Quantcast
Channel: Grant Trebbin
Viewing all 99 articles
Browse latest View live

In Plane Magnetic Field of a Current Loop

$
0
0
Well, this one is a failure (for now).  In the comments on my post about the "Off Axis Magnetic Field of a Circular Current Loop" I was asked why I'd chosen to solve the problem the way I did and why I didn't calculate the Magnetic field using the more familiar version of the Biot Savart law.  I don't know.  I just happened to pick this method and it worked.  I was also asked about calculating the in plane magnetic field of a circular current loop and my response was use the 3 dimensional solution and set z to 0.

I did want to try and calculate it just using the Biot Savart law.  After all, the field shouldn't be that hard to work out.  Due to the geometry of the problem there can only be a magnetic field perpendicular to the plane of the current loop when z=0, and due to rotational symmetry you only need to calculate the magnetic filed along the x axis for example and then revolve it to generate the entire field.  Easy, except I just can't get it.  I'll show my attempt below.

Equations
Magnetic field of a current loop derived from Biot Savart

That's where I hit a wall.  I've made some progress, but I just can't get the equation into a form that makes the use of elliptic integrals easy.  I took the vector cross product of the infinitesimal current element and the vector pointing from the current element to the point that the field is to be calculated at and divided that by the distance between these points squared.  This is then integrated around the current loop.

Diagram
Geometry of the situation

I've performed numerical integration using maxima at various steps of my calculation to make sure I haven't made any mistakes.  Although it's no guarantee I'm right, all the answers match.
Equations
Current Loop In Plane Field Working

Looking at the equation below from my original blog post you can see the equation I'm aiming for if you set z to equal 0.  Plugging numbers into this also yields an answer equal to what my equation above gave.

Equations
Desired Equation

I think this is one of those cases where it's all a mater of finding the right identity or change of variable.  I might let my subconscious work on it for a while and come back to it refreshed.


Update - 4 December 2015

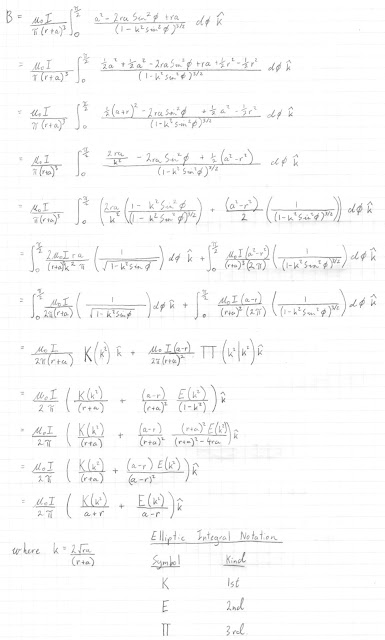
I solved it.  It was relatively easy in the end. I just needed to take a break and look at it differently.

Equations
In plane magnetic field of a circular current loop


Christmas Lights and Their Control Signals

$
0
0
Merry Christmas.  I recently bought a set of LED Christmas lights for a display at work.  They were nothing special, just a cheap set of 4 colour lights that can flash and dim the lights in different patterns.  One thing that stood out was that the plug that connected the string of lights to the power supply only had two contacts.  So how is the controller able to control 4 different colours with only 2 contacts?

Lights
LED Party Lights
The first thing that came to mind was that there must be some sort of communication bus operating over the power rails controlling something like a WS2812 LED (I always come up with the most complicated solution first).  After watching the lights operate it became obvious what was happening.  The blue and green ones operate at the same time, and the orange and red ones are on at the same time as well.  So instead of controlling four different strands of lights the controller only needs to control two, red and orange, blue and green.  This can be easily done by connecting the red/orange and the blue/green LEDs with opposite polarity.  As the lights are LEDs and only conduct when voltage is applied with the correct polarity, applying a positive voltage to the connector, will light up half the lights, and applying a negative voltage will light up the other half.

I didn't have the time to test the set I bought for work, so I bought another smaller set of 100 lights from Bunnings for $10.

Lights
Lytworx LED Lights from Bunnings

Lights
Light String
The power supply is a small light isolated plug-pack that weighs only 51 grams.  I didn't want to open it as the case seems to be ultrasonically welded together and doing so would destroy it.  Given the weight, I'm almost certain that it's a switch-mode supply.  When a scope probe is placed near the case a 12.5 kHz switching signal can be detected with a 250 kHz ringing component.  The observed waveform and frequencies involved are commonly associated with switch-mode supplies.

Plug Pack
Power Supply
The supply has a button on the top that cycles the lights through different display modes.

Plug Pack
Button to change between modes is shown
Something to note that will become important later is that the output voltage of the supply is 31 volts.  How do you power 50 (half at a time of 100) LEDs from 31 volts?  The only other bit of interesting information here is the maximum power of 4 Watts.  That's similar to a USB charger.  Although you could power the lights from a 5 Volt 1 Amp source, without a boost converter the size of the cabling would have to increase to reduce losses.  I do however wonder what will happen if the USB power delivery specification becomes ubiquitous.  It can supply 20 Volts at up to 5 Amps.  Will Christmas lights of the future come with a power supply?  You might just get a string of LEDs with a small in-line button to switch between modes and a USB connector.  What's more likely is a string of lights with a USB connector and bluetooth connectivity (it's trending towards free) to control something like a string of WS2812 lights.  This means that the manufacturer doesn't have to worry about providing a power supply.

Specs
Power Supply Specs
There are 8 different light patterns.  Combination, In Waves, Sequential, Slo Glo, Chasing/Flash, Slow Fade, Twinkle/Flash, and Steady On.  For patterns that require all the lights to be on at once, the voltage alternates between positive and negative at a rate of about 140 Hz.  This means the lights aren't on all the time but the changes are too fast for the eye to notice.  To dim the lights you just need to reduce the fraction of the time that they're on.  If you're unsure of how this works read up on pulse width modulation to catch up.

Light Programs
Different Light Patterns
The string of lights is connected to the power supply via a simple barrel jack.

plug
2 Pin connector
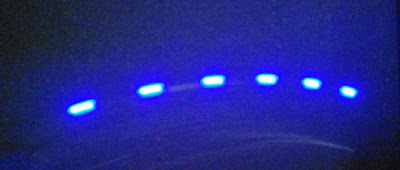
To see if the lights you have use pulse width modulation, wave the lights around quickly.  You should see a dashed line of lights similar to the pattern below.  By comparing the length of the blue streaks to the spaces in between them you can see that the light is on for about 40% of the time.

Lights
Longish exposure showing PWM of LED lights
To see how the 31 Volt supply was connected to the lights I sat down and traced out the wiring.  It turns out that there are 10 strands of lights connected in series.  Each strand contains 10 lights in parallel.  This means each strand is supplied with 3.1 Volts.  This is an interesting point.  All the LEDs seem to be supplied with the same voltage.  The problem with this is that red/orange LEDs only need about 1.8 volts while blue/green ones need closer to 3 volts.  I'm not sure how the red ones are running on 3.1 Volts.  Do they have an integrated resistor or diode on board?  I have a feeling they may all be white LEDs with tinted dies.  When the lights are off and viewed at the correct angle the colour of the light is still visible.  That shouldn't happen.  LEDs don't emit a specific colour of light because they are that colour, the emit coloured light because of the properties and geometry of the semiconductors used.

Below is a small scale representation of the lights containing 2 strands of 4 lights.  The circuit on the left is the easiest way to understand the electrical layout.  This circuit can be rearranged to form a single long string of Christmas lights.  As seen in the image below, one wire runs the length of the string as a current return path, there are also 2 wires that almost run the whole length as well, however between strands there is only one wire.  In the lights I bought, this occurs every tenth light.

Schematic
How the Christmas lights are wired
There you go.  The designers have used a simple arrangement for maximum effect.  By taking advantage of the unidirectional nature of the LEDs and controlling them with PWM, they've created a simple enjoyable product.  To see how the electrical signals correlate with the light patterns, I taped the set of lights around my scope and probed the signal.  Enjoy!


For completeness I've included the labels on the light string as well.


Specs
Light specifications
.
Specs
Light Specifications
.

Air Freshener "DRM"

$
0
0
A family friend recently bought a refill for their automatic air freshener and after one spray a warning light came on to indicate that it wasn't an authentic refill.  After that it wouldn't work any more.  To find out what's going on I bought my own to do a tear down and reveal the secrets of the big freshener cartels. :-)

Air Freshener
AirWick Air Freshener
The kit from the store comes with the automatic sprayer, an authentic refill, and batteries.  You put the can in the sprayer, insert the batteries and turn on the device via a dial on the back.  The dial also allows you to control how often the spray goes off.

Air Freshener
Battery and Fragrance Spray
I also purchased a generic replacement can that causes the problem.  It's the same size as the authentic can, and does work at least once in the sprayer before being identified as inauthentic.  In early versions of the sprayer these cans were interchangeable without causing a problem.

Air Freshener
Replacement Fragrance
A label inside the sprayer describes the problem that I'm investigating.

Instructions
Instructions
When the can is removed, you can see the red lever that pushes down to activate the sprayer.  When a non-original can is used, the red indicator light that goes off is located deep in the case near this lever.

lever
Actuating Lever
After looking at this part of the sprayer closer you can see a small slot in the image below next to the black smudges.  It's hard to make out, but if you know your electronics you can see that they've added a reflective light sensor on a small circuit board.

light sensor
Light Sensor
But what's it sensing?  It's pretty obvious what they're doing when you look at the two nozzles.  The authentic nozzle has two black marks on the shaft while the other one doesn't.  When the nozzle is depressed, The two black stripes pass the light sensor.  The sequence of events that qualify as authentic is unclear.  Is the device looking for rising edges, falling edges or a combination of both on the light sensor?

Nozzles
AirWick Nozzle with black marks.  Replacement without marks.
I wanted a closer look at the sensor so I pulled the rest of the sprayer apart.  The small green motor shown below is what drives the gears to control the lever that depresses the spray can.

Motor
Motor
A doubled sided board containing a chip on board device and a lot of discrete components controls the sprayer.

PCB
Control PCB
.
PCB
PCB Bottom
In the image below you can see a 4 pin header that's connected to a secondary board containing the light sensor.

PCB
PCB Top
The sensor is wedged in placed by a plastic retaining guide.

Light Sensor
Add caption
The sensor is the standard two part reflective type.  It's hard to see, but the device below is divided into two parts.  One half is an infra-red LED and the other half is a sensor to detect any reflected light from the LED.

Light Sensor

So everything is now clear.  When you insert a non authentic can and turn the device on, it presses the can the first time, as it does this it tries to detect the the black marks on the stem of the nozzle.  If it can't find them it will stop working.   To make it work again, the sprayer needs to be turned off and on again.

How do you get around it?  Well, you can just get a marker pen and draw two lines on the stem of the other nozzle.  I should point out that the nozzles aren't interchangeable as the size of the part it connects to on the can is different.  The nozzle with the marks has a larger internal shaft.  In theory you could also slip something like a small piece of plastic tubing over the part that comes out of the can before attaching the nozzle to space it out.  That would be hard to find though as it's a very specific size.

Another way to solve this would be to program a cheap microcontroller to only power the device at specified times.  This circuit could be powered by the batteries that the sprayer uses.  After power is restored the sprayer would spray the can and then fail.  After the fail you would then cut power again as the red indicator light would keep flashing and waste power.  With appropriate hardware the restart could also be triggered by light, sound, or remotely via a phone.

I just find it a bit strange that they decided to put so much effort into something that's ultimately easy to bypass.  Can't the generic cans just go and get their own sprayer made?  It's not a complicated piece of equipment.  Then again, I'm not an insider in the high stakes world of automated air fresheners.

Find All Triangles In A Diagram And Add Together The Numbers They Contain

$
0
0
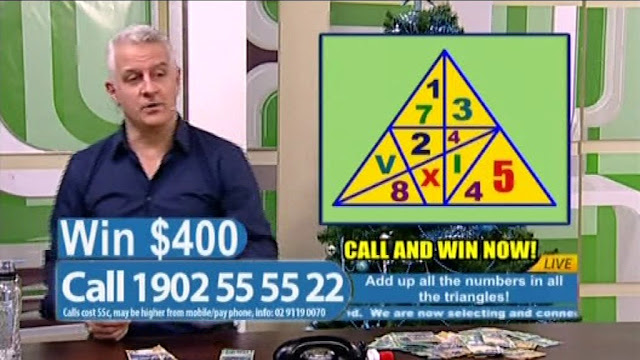
If you're a night owl like me you may have come across those late night game shows where you call in to win money.  I'm not a fan of them.  The rules are very vague, and they're broadcast on channel 74 (4ME) at a highly compressed resolution at 576i, so it can be hard to see some of the details (especially for older people).  You've got to hand it to the hosts though, there's no way I couldn't stand there for hours babbling on a about nothing, that's what I have a blog for :-)

One of the games they've been playing lately intrigued me.  You have to find all the triangles in a diagram like the one below, and then add all the numbers in each triangle together to reach a final value.

Game Show
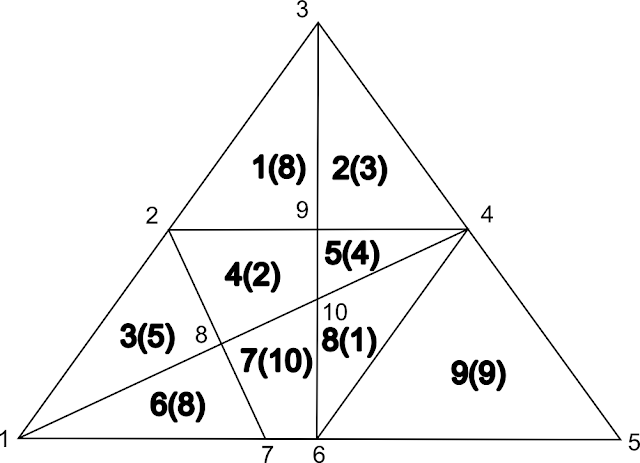
Puzzle from Call and Win 15/12/2015

The host suggests a way to find the answer by drawing it out and finding all the triangles manually, and sure it'll work, but where's the fun in that I ask you?  Can we write software to find the answer?  Of course we can.

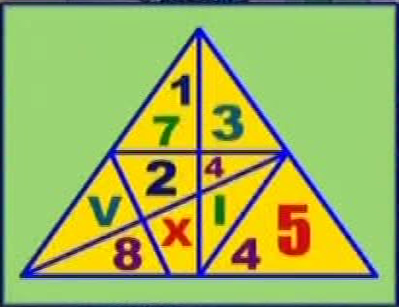
We'll start by taking a closer look at the puzzle.  They use a mix of Roman and Arabic numeral to be "tricky".  There are also some areas with multiple number in them.  For our analysis these will be simplified manually when the problem is defined in software.


Puzzle
Puzzle

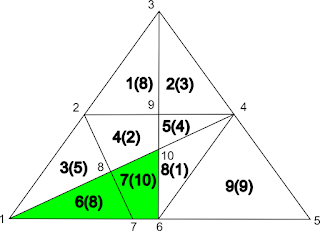
To start with, let's strip all the useless information and number each vertex.  Each region will also be labelled with a number and its value placed in brackets.  Now we can discuss the problem in formal terms.

To define the puzzle in terms that software can understand, it isn't sufficient to just feed it a list of vertices and how they're connected.  For example, in the image below, if vertex 5 is moved into region 8. The connections of the graph are preserved, but its shape is changed.  To make sure that the structure is well defined, it's better to define the network by describing each region by a list of vertices in a consistent clockwise or anticlockwise manner.  This isn't exactly true, but it works for this problem.  (I've had a crash course in graph theory and discovered and learnt some interesting things)  That's great, but you can't find triangles with just a  definition of the regions.  A graph isn't a geometric representation of a structure, it just defines connections.  Adding a list of the straight lines in the graph will enable us to solve the problem.  These are defined by listing all groups of 3 or more vertices that are collinear (2 vertices are trivially collinear so they don't need to be defined).

Structured Network
Structured Network

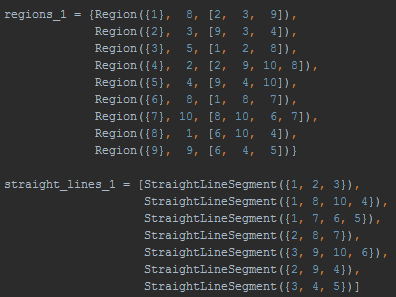
The above structured network (I'm calling it that because it's a network, but it has some geometric constraints) can be defined by the following 16 lines of code.  The Region objects are defined by supplying an id, a value, and a list of vertices.  The StraightLineSegment objects are defined by a set of vertices.

Code
Defining the structured network

We now have the network defined in software, but how do we actually solve the problem?  The human way to go about it is to find the triangles and then add all the numbers in them.  It's trivial to write a program to find the triangles in the network.  For example pick, vertex 1, it's connected by straight lines to vertices 2, 3, 8, 10, 4, 7, 6, 5.  For each of these vertices you would then repeat the process.  Let's choose vertex 2.  It's connected to vertices (1, 8, 7, 9, 4, 3) by straight lines. You ignore vertex 1 because that's where you came from, but if any of these vertices can be connected back to vertex 1, you've found a triangle.  Out of that last list, vertices (8, 7, 4, 3) connect to vertex 1.  This means you've found 3 triangles, (1,2,8), (1,2,7), (1,2,4).  You ignore vertex 3 because it's a straight line.  There's a subtle problem with that though.  It's hard to find the regions that make up a compound region like the one constrained by the vertices (1, 2, 4).  This means it's hard to add the numbers together.  It's easy for humans, but it's not as simple for computers.

The way I've chosen to solve the problem is to find every possible compound region in the network adding the values as I go.  The triangular regions are then identified and the others are discarded.


Structured Network
Finding compound regions

You may be thinking "Oh, it's just combinations of regions", but hold on.  If I want the region that's a combination of regions 6, 7, and 8.  You need to know how to construct it. (Region 6 + Region 7) + Region 8 makes sense, but (Region 6 + Region 8) + Region 7 doesn't.  Adding Region 6 to 8 doesn't make sense they aren't connected.  This implies that Region addition isn't commutative.

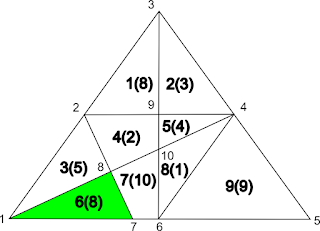
The easiest way to find all compound regions is to start with all the base regions and see how many regions with two base regions you can find.  For example if we select region 6.  It's connected to regions 3 and 7.


Structured Network
Expanding a region

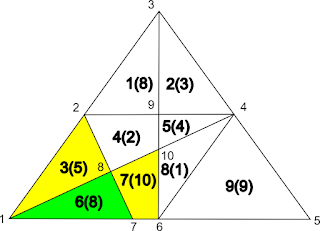
This means you've found two regions with 2 base regions. The new regions are region {6, 3} and region {6, 7}.  Because they've been discovered by looking at connected regions it's easy to find the vertices that describe their edges.  It's also easy to add their values.

Structured Network
Compound region {6,7}

You'll find duplicate regions using this method, but they're easily removed.  Once you've found all the compound regions with 2 base regions in them, you can repeat the process to find all the regions with 3 base regions in them.  For example if region {6, 7} is chosen, you can see that 3 new regions {3, 6, 7} {4, 6, 7} and {6, 7, 8} are found.  This process is repeated until you find a region that contains all base regions.  Once this point is reached, there are no more regions to add.
Structured Network
Expanding region {6,7}
Now triangles need to be identified.  Let's look at region {6, 7, 8}.  It's defined by a vertex list of [1, 8, 10, 4, 6, 7].  If we look at this ordered circular list 3 vertices at a time we can find vertices to remove.  For example vertices [1, 8 ,10] are collinear.  This means we can remove vertex 8 from the list.  Repeating this process until no more vertices can be removed will show if the region is triangular.

For example
[1, 8, 10, 4, 6, 7] -> [1, 10, 4, 6, 7] -> [1, 4, 6, 7] -> [1, 4, 6]

You now have a list containing 3 vertices.  This means it's a triangle.  You then just go through and find the sum of all these elements.  I'll go into some more of the theory and implementation in the next blog post, but that's the basics of it.

If you've read this far I bet you've tried to work out the answer.  Scroll to the bottom of this page and you can see the output of my program with the answer way down the bottom

https://github.com/GrantTrebbin/TriangleGame
Get the code!


Base regions ({id} =value= *vertices*)
count = 9

({7} =10= *10* *6* *7* *8*)
({5} =4= *9* *4* *10*)
({3} =5= *1* *2* *8*)
({6} =8= *1* *8* *7*)
({8} =1= *6* *10* *4*)
({4} =2= *10* *8* *2* *9*)
({1} =8= *2* *3* *9*)
({2} =3= *4* *9* *3*)
({9} =9= *5* *6* *4*)


Multi edge straight lines -*vertices*-
count = 7

-*1* *2* *3*-
-*8* *1* *10* *4*-
-*1* *5* *6* *7*-
-*8* *2* *7*-
-*9* *10* *3* *6*-
-*9* *2* *4*-
-*3* *4* *5*-


edge list |*vertices*| -> {connected region id}
count = 18

|*9* *2*| -> {4}{1}
|*10* *6*| -> {7}{8}
|*9* *4*| -> {5}{2}
|*1* *7*| -> {6}
|*3* *4*| -> {2}
|*8* *1*| -> {6}{3}
|*1* *2*| -> {3}
|*6* *7*| -> {7}
|*8* *2*| -> {4}{3}
|*9* *3*| -> {2}{1}
|*8* *7*| -> {6}{7}
|*2* *3*| -> {1}
|*8* *10*| -> {7}{4}
|*4* *6*| -> {8}{9}
|*5* *6*| -> {9}
|*10* *4*| -> {5}{8}
|*9* *10*| -> {4}{5}
|*4* *5*| -> {9}


Compound regions ({id} =value= *vertices*)
count = 174

({4, 6, 7} =20= *6* *7* *1* *8* *2* *9* *10*)
({6, 7} =18= *10* *6* *7* *1* *8*)
({1, 2, 4, 5, 7, 8, 9} =37= *3* *4* *5* *6* *7* *8* *2*)
({1, 4, 7} =20= *2* *3* *9* *10* *6* *7* *8*)
({8, 9} =10= *5* *6* *10* *4*)
({8, 1, 4, 5, 7} =25= *4* *6* *7* *8* *2* *3* *9*)
({1, 2, 3, 4, 5, 6, 8} =31= *1* *2* *3* *4* *6* *10* *8* *7*)
({2, 3, 4, 5, 6, 8} =23= *1* *2* *9* *3* *4* *6* *10* *8* *7*)
({1, 3, 4, 7, 8, 9} =35= *1* *2* *3* *9* *10* *4* *5* *6* *7* *8*)
({1, 3, 4, 5, 7} =29= *4* *10* *6* *7* *8* *1* *2* *3* *9*)
({1, 4, 5, 6, 7, 8} =33= *3* *9* *4* *6* *7* *1* *8* *2*)
({5} =4= *9* *4* *10*)
({1, 3, 4, 6, 7, 8, 9} =43= *5* *6* *7* *1* *2* *3* *9* *10* *4*)
({2, 5, 6, 7, 8, 9} =35= *4* *5* *6* *7* *1* *8* *10* *9* *3*)
({3, 4} =7= *1* *2* *9* *10* *8*)
({8, 9, 6, 7} =28= *5* *6* *7* *1* *8* *10* *4*)
({2, 5} =7= *4* *10* *9* *3*)
({8, 4, 7} =13= *6* *7* *8* *2* *9* *10* *4*)
({1, 4, 5, 7} =24= *6* *7* *8* *2* *3* *9* *4* *10*)
({1, 2, 3, 4, 7, 8, 9} =38= *5* *6* *7* *8* *1* *2* *3* *4* *9* *10* *4*)
({8, 9, 4, 5} =16= *4* *5* *6* *10* *8* *2* *9*)
({8, 9, 4, 5, 1} =24= *4* *5* *6* *10* *8* *2* *3* *9*)
({1, 4, 5, 6, 7} =32= *6* *7* *1* *8* *2* *3* *9* *4* *10*)
({2, 3, 4, 5, 7} =24= *4* *10* *6* *7* *8* *1* *2* *9* *3*)
({1, 3, 4, 6, 7, 8} =34= *7* *1* *2* *3* *9* *10* *4* *6*)
({1, 3, 4} =15= *2* *3* *9* *10* *8* *1*)
({8, 5} =5= *9* *4* *6* *10*)
({1, 2, 5, 6, 7, 8} =34= *3* *4* *6* *7* *1* *8* *10* *9* *2*)
({2, 3, 4, 5, 6} =22= *4* *10* *8* *7* *1* *2* *9* *3*)
({8, 1, 2, 4, 5} =18= *8* *2* *3* *4* *6* *10*)
({8, 3, 4, 5, 6} =20= *1* *2* *9* *4* *6* *10* *8* *7*)
({3, 4, 5} =11= *8* *1* *2* *9* *4* *10*)
({2, 3, 5, 6, 7, 8} =31= *9* *3* *4* *6* *7* *1* *2* *8* *10*)
({8, 1, 4, 5} =15= *8* *2* *3* *9* *4* *6* *10*)
({1, 3, 4, 7} =25= *10* *6* *7* *8* *1* *2* *3* *9*)
({3, 4, 5, 7, 8, 9} =31= *5* *6* *7* *8* *1* *2* *9* *4*)
({6} =8= *1* *8* *7*)
({8, 4, 5, 7} =17= *9* *4* *6* *7* *8* *2*)
({8, 9, 5} =14= *5* *6* *10* *9* *4*)
({8, 2, 5} =8= *4* *6* *10* *9* *3*)
({8, 2, 3, 4, 5} =15= *8* *1* *2* *9* *3* *4* *6* *10*)
({1} =8= *2* *3* *9*)
({1, 2, 3, 4, 5, 6, 7, 8} =41= *7* *1* *2* *3* *4* *6*)
({2, 3, 4, 5, 6, 8, 9} =32= *4* *5* *6* *10* *8* *7* *1* *2* *9* *3*)
({3, 4, 5, 7} =21= *1* *2* *9* *4* *10* *6* *7* *8*)
({8, 9, 2, 4, 5} =19= *4* *5* *6* *10* *8* *2* *9* *3*)
({2, 4, 5, 7} =19= *4* *10* *6* *7* *8* *2* *9* *3*)
({4, 7} =12= *6* *7* *8* *2* *9* *10*)
({1, 2, 5, 6, 7, 8, 9} =43= *3* *4* *5* *6* *7* *1* *8* *10* *9* *2*)
({2, 3, 4, 5} =14= *4* *10* *8* *1* *2* *9* *3*)
({9} =9= *5* *6* *4*)
({1, 4, 6, 7, 8, 9} =38= *3* *9* *10* *4* *5* *6* *7* *1* *8* *2*)
({4, 5, 6, 7} =24= *6* *7* *1* *8* *2* *9* *4* *10*)
({8, 5, 7} =15= *6* *7* *8* *10* *9* *4*)
({1, 2, 3, 4, 5, 6, 7, 8, 9} =50= *1* *2* *3* *4* *5* *6* *7*)
({8, 1, 3, 4, 5} =20= *8* *1* *2* *3* *9* *4* *6* *10*)
({2} =3= *4* *9* *3*)
({8, 9, 5, 7} =24= *5* *6* *7* *8* *10* *9* *4*)
({1, 2, 4, 6, 7, 8} =32= *3* *4* *9* *10* *4* *6* *7* *1* *8* *2*)
({3, 4, 6} =15= *1* *2* *9* *10* *8* *7*)
({3, 4, 7} =17= *1* *2* *9* *10* *6* *7* *8*)
({1, 2, 4, 5, 8, 9} =27= *8* *2* *3* *4* *5* *6* *10*)
({2, 4, 5, 6, 7, 8, 9} =37= *4* *5* *6* *7* *1* *8* *2* *9* *3*)
({1, 3, 4, 5, 7, 8, 9} =39= *4* *5* *6* *7* *8* *1* *2* *3* *9*)
({3, 4, 5, 6} =19= *8* *7* *1* *2* *9* *4* *10*)
({1, 3, 4, 5, 6, 7} =37= *6* *7* *1* *2* *3* *9* *4* *10*)
({8, 9, 2, 5, 1} =25= *3* *4* *5* *6* *10* *9* *2*)
({1, 2, 4, 5, 6, 7, 8} =36= *3* *4* *6* *7* *1* *8* *2*)
({3, 5, 6, 7, 8, 9} =37= *9* *4* *5* *6* *7* *1* *2* *8* *10*)
({8, 9, 3, 6, 7} =33= *4* *5* *6* *7* *1* *2* *8* *10*)
({1, 2, 5, 7, 8, 9} =35= *3* *4* *5* *6* *7* *8* *10* *9* *2*)
({1, 2, 4, 6, 7, 8, 9} =41= *5* *6* *7* *1* *8* *2* *3* *4* *9* *10* *4*)
({1, 2, 3, 4, 6, 7, 8, 9} =46= *5* *6* *7* *1* *2* *3* *4* *9* *10* *4*)
({8, 1, 4, 6, 7} =29= *7* *1* *8* *2* *3* *9* *10* *4* *6*)
({1, 4} =10= *10* *8* *2* *3* *9*)
({2, 4, 5, 6, 7} =27= *4* *10* *6* *7* *1* *8* *2* *9* *3*)
({1, 2, 4, 5, 7} =27= *2* *3* *4* *10* *6* *7* *8*)
({3, 4, 5, 6, 7} =29= *6* *7* *1* *2* *9* *4* *10*)
({1, 2, 4, 7, 8, 9} =33= *5* *6* *7* *8* *2* *3* *4* *9* *10* *4*)
({3, 4, 6, 7, 8, 9} =35= *5* *6* *7* *1* *2* *9* *10* *4*)
({4, 5, 7} =16= *6* *7* *8* *2* *9* *4* *10*)
({3, 4, 5, 6, 7, 8} =30= *7* *1* *2* *9* *4* *6*)
({8, 1, 2, 4, 7} =24= *6* *7* *8* *2* *3* *4* *9* *10* *4*)
({1, 2, 3, 4, 6, 7} =36= *6* *7* *1* *2* *3* *4* *9* *10*)
({8, 2, 5, 6, 7} =26= *4* *6* *7* *1* *8* *10* *9* *3*)
({8, 1, 2, 5} =16= *3* *4* *6* *10* *9* *2*)
({8, 6, 7} =19= *7* *1* *8* *10* *4* *6*)
({1, 2, 3, 5, 6, 7, 8, 9} =48= *3* *4* *5* *6* *7* *1* *2* *8* *10* *9* *2*)
({8, 3, 5, 6, 7} =28= *9* *4* *6* *7* *1* *2* *8* *10*)
({8, 1, 3, 4, 7} =26= *1* *2* *3* *9* *10* *4* *6* *7* *8*)
({2, 4, 5, 6, 7, 8} =28= *7* *1* *8* *2* *9* *3* *4* *6*)
({1, 3, 4, 5, 7, 8} =30= *1* *2* *3* *9* *4* *6* *7* *8*)
({2, 3, 5, 6, 7, 8, 9} =40= *9* *3* *4* *5* *6* *7* *1* *2* *8* *10*)
({1, 2, 4, 5, 6, 7, 8, 9} =45= *3* *4* *5* *6* *7* *1* *8* *2*)
({8, 9, 4, 7} =22= *5* *6* *7* *8* *2* *9* *10* *4*)
({1, 2, 3, 4, 5, 8, 9} =32= *2* *3* *4* *5* *6* *10* *8* *1*)
({8, 2, 4, 5} =10= *4* *6* *10* *8* *2* *9* *3*)
({3} =5= *1* *2* *8*)
({8, 3, 4, 5, 7} =22= *6* *7* *8* *1* *2* *9* *4*)
({2, 3, 4, 5, 7, 8, 9} =34= *1* *2* *9* *3* *4* *5* *6* *7* *8*)
({1, 2, 4, 5, 6, 7} =35= *3* *4* *10* *6* *7* *1* *8* *2*)
({1, 3, 4, 5, 6, 8, 9} =37= *4* *5* *6* *10* *8* *7* *1* *2* *3* *9*)
({8, 9, 2, 5, 7} =27= *3* *4* *5* *6* *7* *8* *10* *9*)
({8, 3, 4, 5} =12= *8* *1* *2* *9* *4* *6* *10*)
({8, 9, 3, 4, 7} =27= *1* *2* *9* *10* *4* *5* *6* *7* *8*)
({2, 3, 4, 5, 6, 7, 8, 9} =42= *4* *5* *6* *7* *1* *2* *9* *3*)
({8, 9, 2, 5} =17= *4* *5* *6* *10* *9* *3*)
({1, 3, 4, 5, 8, 9} =29= *4* *5* *6* *10* *8* *1* *2* *3* *9*)
({1, 2, 3, 4, 5, 6, 8, 9} =40= *1* *2* *3* *4* *5* *6* *10* *8* *7*)
({1, 3, 4, 5, 6, 7, 8, 9} =47= *4* *5* *6* *7* *1* *2* *3* *9*)
({1, 3, 4, 6, 7} =33= *7* *1* *2* *3* *9* *10* *6*)
({1, 3, 4, 5, 6} =27= *4* *10* *8* *7* *1* *2* *3* *9*)
({8, 4, 6, 7} =21= *7* *1* *8* *2* *9* *10* *4* *6*)
({1, 4, 5} =14= *8* *2* *3* *9* *4* *10*)
({2, 3, 4, 5, 7, 8} =25= *4* *6* *7* *8* *1* *2* *9* *3*)
({1, 2, 3, 4, 5, 7, 8} =33= *1* *2* *3* *4* *6* *7* *8*)
({1, 3, 4, 5} =19= *4* *10* *8* *1* *2* *3* *9*)
({8, 9, 3, 4, 5} =21= *2* *9* *4* *5* *6* *10* *8* *1*)
({1, 3, 4, 5, 6, 7, 8} =38= *7* *1* *2* *3* *9* *4* *6*)
({8, 9, 4, 5, 7} =26= *9* *4* *5* *6* *7* *8* *2*)
({8, 3, 4, 7} =18= *7* *8* *1* *2* *9* *10* *4* *6*)
({8, 7} =11= *7* *8* *10* *4* *6*)
({3, 6, 7} =23= *7* *1* *2* *8* *10* *6*)
({1, 3, 4, 5, 6, 8} =28= *1* *2* *3* *9* *4* *6* *10* *8* *7*)
({3, 4, 5, 6, 7, 8, 9} =39= *5* *6* *7* *1* *2* *9* *4*)
({2, 4, 5} =9= *4* *10* *8* *2* *9* *3*)
({8, 9, 7} =20= *4* *5* *6* *7* *8* *10*)
({8, 9, 7, 4, 1} =30= *10* *4* *5* *6* *7* *8* *2* *3* *9*)
({1, 2, 3, 4, 5, 6, 7} =40= *6* *7* *1* *2* *3* *4* *10*)
({3, 6} =13= *1* *2* *8* *7*)
({1, 2, 3, 4} =18= *2* *3* *4* *9* *10* *8* *1*)
({1, 2} =11= *2* *3* *4* *9*)
({8, 4, 5} =7= *4* *6* *10* *8* *2* *9*)
({1, 2, 4} =13= *8* *2* *3* *4* *9* *10*)
({1, 4, 6, 7} =28= *10* *6* *7* *1* *8* *2* *3* *9*)
({8, 9, 4, 6, 7} =30= *9* *10* *4* *5* *6* *7* *1* *8* *2*)
({1, 2, 3, 4, 6} =26= *8* *7* *1* *2* *3* *4* *9* *10*)
({1, 2, 3, 4, 5, 6} =30= *1* *2* *3* *4* *10* *8* *7*)
({1, 2, 4, 6, 7} =31= *6* *7* *1* *8* *2* *3* *4* *9* *10*)
({3, 4, 5, 6, 8, 9} =29= *1* *2* *9* *4* *5* *6* *10* *8* *7*)
({1, 3, 4, 6} =23= *10* *8* *7* *1* *2* *3* *9*)
({7} =10= *10* *6* *7* *8*)
({2, 4, 5, 7, 8, 9} =29= *4* *5* *6* *7* *8* *2* *9* *3*)
({1, 2, 4, 7} =23= *6* *7* *8* *2* *3* *4* *9* *10*)
({3, 4, 6, 7} =25= *10* *6* *7* *1* *2* *9*)
({1, 2, 3, 4, 6, 7, 8} =37= *7* *1* *2* *3* *4* *9* *10* *4* *6*)
({1, 2, 4, 5} =17= *3* *4* *10* *8* *2*)
({1, 2, 3, 4, 5} =22= *2* *3* *4* *10* *8* *1*)
({2, 3, 4, 5, 6, 7, 8} =33= *7* *1* *2* *9* *3* *4* *6*)
({8, 1, 4, 7} =21= *7* *8* *2* *3* *9* *10* *4* *6*)
({1, 2, 3, 4, 5, 8} =23= *8* *1* *2* *3* *4* *6* *10*)
({8, 5, 6, 7} =23= *6* *7* *1* *8* *10* *9* *4*)
({1, 2, 4, 5, 7, 8} =28= *3* *4* *6* *7* *8* *2*)
({8, 3, 4, 6, 7} =26= *7* *1* *2* *9* *10* *4* *6*)
({8} =1= *6* *10* *4*)
({1, 2, 3, 4, 5, 7, 8, 9} =42= *1* *2* *3* *4* *5* *6* *7* *8*)
({1, 2, 3, 5, 6, 7, 8} =39= *3* *4* *6* *7* *1* *2* *8* *10* *9* *2*)
({8, 2, 5, 7} =18= *3* *4* *6* *7* *8* *10* *9*)
({8, 1, 2, 5, 7} =26= *3* *4* *6* *7* *8* *10* *9* *2*)
({8, 9, 5, 6, 7} =32= *5* *6* *7* *1* *8* *10* *9* *4*)
({1, 4, 5, 7, 8, 9} =34= *3* *9* *4* *5* *6* *7* *8* *2*)
({8, 2, 4, 5, 7} =20= *7* *8* *2* *9* *3* *4* *6*)
({2, 3, 4, 5, 6, 7} =32= *4* *10* *6* *7* *1* *2* *9* *3*)
({4} =2= *10* *8* *2* *9*)
({1, 2, 5} =15= *3* *4* *10* *9* *2*)
({2, 3, 4, 5, 8, 9} =24= *2* *9* *3* *4* *5* *6* *10* *8* *1*)
({1, 2, 3, 4, 5, 7} =32= *1* *2* *3* *4* *10* *6* *7* *8*)
({1, 2, 3, 4, 7} =28= *1* *2* *3* *4* *9* *10* *6* *7* *8*)
({4, 5, 6, 7, 8, 9} =34= *9* *4* *5* *6* *7* *1* *8* *2*)
({1, 4, 5, 6, 7, 8, 9} =42= *4* *5* *6* *7* *1* *8* *2* *3* *9*)
({8, 3, 6, 7} =24= *4* *6* *7* *1* *2* *8* *10*)
({1, 2, 3, 4, 7, 8} =29= *1* *2* *3* *4* *9* *10* *4* *6* *7* *8*)
({8, 4, 5, 6, 7} =25= *6* *7* *1* *8* *2* *9* *4*)
({4, 5} =6= *4* *10* *8* *2* *9*)


Triangular Regions ({id} =value= *vertices*)
count = 22

({8, 6, 7} =19= *7* *1* *8* *10* *4* *6*)
({3, 6} =13= *1* *2* *8* *7*)
({1, 2} =11= *2* *3* *4* *9*)
({6, 7} =18= *10* *6* *7* *1* *8*)
({1, 2, 3, 4, 5} =22= *2* *3* *4* *10* *8* *1*)
({5} =4= *9* *4* *10*)
({3} =5= *1* *2* *8*)
({8, 9, 6, 7} =28= *5* *6* *7* *1* *8* *10* *4*)
({2, 5} =7= *4* *10* *9* *3*)
({9} =9= *5* *6* *4*)
({2} =3= *4* *9* *3*)
({8, 9, 2, 5} =17= *4* *5* *6* *10* *9* *3*)
({1, 2, 3, 4, 5, 6, 7, 8, 9} =50= *1* *2* *3* *4* *5* *6* *7*)
({1, 3, 4, 6, 7} =33= *7* *1* *2* *3* *9* *10* *6*)
({8} =1= *6* *10* *4*)
({1, 3, 4} =15= *2* *3* *9* *10* *8* *1*)
({8, 5} =5= *9* *4* *6* *10*)
({8, 2, 5} =8= *4* *6* *10* *9* *3*)
({3, 4, 5} =11= *8* *1* *2* *9* *4* *10*)
({6} =8= *1* *8* *7*)
({1} =8= *2* *3* *9*)
({4, 5} =6= *4* *10* *8* *2* *9*)


Sum of all the numbers in each triangular region = 301

Merging Regions Defined by a List of Vertices

$
0
0
In my last post I described a strategy for solving something I call the Triangle Game.  I supplied code and gave a quick description of its operation.  In this post I'll go into some of the finer details and explain the process of merging regions described by a list of vertices.  I've taken a subset of the game described in the last post and will use it to illustrate some points.

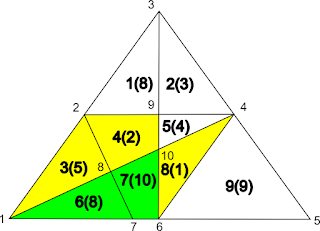
First a description of how the game works.  It's simple, add up all the numbers in all the triangles in the puzzle.  In the game below the numbers to add are in parentheses.  These follow a number that identifies the region.  For example 6(8) refers to region 6 that has a value of 8.  It's easy to see that regions 6, 8 and 9 form triangles, but there are other triangles as well.  The combination of region 6 and 7 also forms a triangle.  The key to solving this problem is to identify all the triangles by finding all possible combinations of regions and identifying which of these have shapes that can be described by a list of only three vertices.

Puzzle - Planar Graph
You may ask why I didn't try to find triangular shapes and then add the triangles in that shape.  That seems easy, if I asked you to add the numbers in the triangle formed by the vertices 1, 4, and 6, you'd be easily able to tell me the answer is 8 + 10 + 1 = 19, but to do that you've used your vision system to identify which regions lie within this triangle.  When you're supplied with a list of vertices, connections, and straight lines with no specific information about geometry this task becomes harder.  I'll let you ponder this, in the image below find a programmatic way to determine that the blue triangle is located with the triangle formed by the three black dots.

How can you tell that the blue triangle is bounded by the 3 black dots?


I've done a little more reading since the first post and can describe things in more formal terms.  The puzzle is actually a planar graph, that is made up of the numbered regions and an external region that's ignored.  The funny thing is that the dual of the graph is more interesting.  The dual of a graph is made by placing a connection between regions every time an edge is encountered.  This usually includes a connection to a vertex in the external region, these are show below in grey, but in our case these can be ignored leaving only the graph shown in red.

Exploring this graph will identify all regions.  For example there are regions for each node 6, 7, 8, and 9.   There are regions for for each single edge (6, 7), (7, 8), and (8, 9), there are regions for each double connection (6, 7, 8), and (7, 8, 9), and finally there is a region for the single triple connections (6, 7, 8, 9).


Dual of the puzzle graph

I'll run through the output of what happens when the above graph is entered into the software I wrote.


Firstly the regions of the graph that you supply are just echoed back.

Base regions ({id} =value= *vertices*)
count = 4

({6} =8= *1* *8* *7*)
({7} =10= *7* *8* *10* *6*)
({8} =1= *4* *6* *10*)
({9} =9= *5* *6* *4*)


The multi edge straight lines that you supply are echoed back.

Multi edge straight lines -*vertices*-
count = 2

-*8* *1* *10* *4*-
-*1* *5* *6* *7*-


Each region is inspected and each edge is added to a dictionary along with the region it is connected to. When completed you can easily see the regions that are connected by an edge.

edge list |*vertices*| -> {connected region id}
count = 10

|*4* *5*| -> {9}
|*8* *7*| -> {6}{7}
|*10* *6*| -> {7}{8}
|*1* *7*| -> {6}
|*4* *6*| -> {8}{9}
|*8* *1*| -> {6}
|*10* *4*| -> {8}
|*8* *10*| -> {7}
|*6* *7*| -> {7}
|*5* *6*| -> {9}
 

Compound regions are found by starting with base singular regions. Each edge of a region is checked against the list of edges above to see if any other region can be added to it. If so the new region is added to a set.  This prevents duplicates.  You will now have found all the compound regions containing 2 base regions.  This is repeated until all regions are found.

Compound regions ({id} =value= *vertices*)
count = 10

({8, 6, 7} =19= *7* *1* *8* *10* *4* *6*)
({7} =10= *7* *8* *10* *6*)
({8, 9} =10= *4* *5* *6* *10*)
({8, 7} =11= *7* *8* *10* *4* *6*)
({6} =8= *1* *8* *7*)
({8, 9, 6, 7} =28= *7* *1* *8* *10* *4* *5* *6*)
({8, 9, 7} =20= *10* *4* *5* *6* *7* *8*)
({6, 7} =18= *7* *1* *8* *10* *6*)
({8} =1= *4* *6* *10*)
({9} =9= *5* *6* *4*)


Each new region is checked to see if is triangular, if so, it can be added to the answer.  For example, region {6, 7, 8, 9} is described by the vertices (7, 1, 8, 10, 4, 5, 6), but looking at this circular list 3 vertices at a time we can reduce it to a triangle. 1, 8, and 10 are collinear, therefore 8 can be deleted. repeating this pattern we get the following (7, 1, 10, 4, 5, 6) - (7, 1, 4, 5, 6) - (7, 1, 4, 5) - (1, 4, 5)

Triangular Regions ({id} =value= *vertices*)
count = 6

({8, 6, 7} =19= *7* *1* *8* *10* *4* *6*)
({6} =8= *1* *8* *7*)
({6, 7} =18= *7* *1* *8* *10* *6*)
({8} =1= *4* *6* *10*)
({8, 9, 6, 7} =28= *7* *1* *8* *10* *4* *5* *6*)
({9} =9= *5* *6* *4*)


Sum of all the numbers in each triangular region = 83


The value of these triangles is added together to find the answer.  In this case it's 83.

So far I've mentioned merging or adding regions together.  What does that actually mean?  As all the regions have a numerical value or worth, the first step is to just add these together.  To put it simply imagine you and your neighbour wanted to join your blocks of land, and you wanted to know how many trees would be on the new block.  If you previously had 2 and they had 5, the new block would have 7 trees.  This is great but it doesn't describe the shape of the new property.  For that you need to supply a list of vertices that describe the boundary.

If we're smart about it and describe each boundary with a circular list in a consistent clockwise or anticlockwise manner we'll make things easier for later.  For the examples going forward I'll use the letters R (red), G (green), and B (blue) to describe the regions.  The two regions below can be described as

R = [a, b e, f]
G =  [b, c, d, e]

 Two connected regions

To add them together a shared edge needs to be found, in this case that's b-e.  The circular vertex lists describing each region are now rotated until this shared edge is at the end if it isn't already.

R = [f, a, b, e]
G = [c, d, e, b]


Joining the vertex lists is done by removing the last vertex from each list and then concatenating them.  As the lists have been defined with a consistent direction of rotation, the joining process is simple.

{R, G} = [f, a, b, c, d, e]
Regions joined on edge b-e
What if the regions have more than one shared edge?  The same process can still be used.  If R = [a, b, g, h, e, f] and G = [b, c, d, e, h, g].

Two regions that share more than one edge
Joining them on the edge h-e will give the new region {R, G} = [f, a, b, g, h, g, b, c, d, e].  This new region is a bit strange though.  It has a fold.  These can be identified by vertices that double back on themselves. In this case g, h, g.

Join regions on edge h-e
Removing this fold can be done by replacing the vertices g, h, g with just g to get {R, G} = [f, a, b, g, b, c, d, e]

Remove folded edge g-h
Likewise the fold b, g, b, can be removed to give {R, G} = [f, a, b, c, d, e]

Remove folded edge b-g
We've show that joining multiple regions is possible, but what if they're not consecutive edges.  In the structure below, if regions R and G are joined, that can be done on the the edge b-h or the edge k-e.  Depending on the edge chosen, the result will be different.  This happens because the outline of the internal region made when R and G are added still needs to be connected to the outer border.  Imagine tracing the border with a pencil and not lifting the pencil.  You have to pick a way to get between the outer and inner borders.

3 Region Graph
By joining the regions on the edge k-e, there's an implicit decision to get between the inner and outer borders via the edge b-h.

Join regions R and G on edge k-e
Adding the region B to region {R, G} can now be done.  It will require removing multiple folds that form a tree.  A recursive process of removing folds will ultimately yield the simplest outer border.

Add region B to region (R + G) on edge l-k
.
Remove folded edge g-l
.
Remove folded edge g-h
.
Remove folded edge k-j
.
Remove folded edge j-i
.
Remove folded edge h-i
.
Remove folded edge b-h

A few observations I made while exploring region merging are worth mentioning.  In the graph below, if the only regions defined are [a, d, f, c], [a, b, e, d], and [c, f, e, b] the graph can only be assembled in one way.  That will give an internal region of [f, d, e].

4 region graph defined when 3 regions supplied

However, in the two graphs below if only the regions [a, b, h, g, l, k, e, f] and [b, c, d, e, k, j, i, h] are defined there are 2 configurations that will give different graphs.  One will contain an internal region of [g, h, i, j, k, l] and the other will contain an internal region of [f, e, d, c, b, a].  So to completely specify the graph all of the regions need to be specified in this case.  I don't know what differentiates the two scenarios.  Maybe the case of two regions with multiple non consecutive shared edges is the only example of this effect.  I don't know. I haven't put much thought into it.  I just thought that it was worth mentioning.

3 region graph defined by 2 regions - configuration 1
.
3 region graph defined by two regions - configuration2

I'll leave you with a few resources you should probably look at before starting on any project like this.  There is a standard notation to describe planar graphs called a "combinatorial map".  There is also a standard, ISO 10303, that explains how to exchange boundary representation of models. Finally there is the Computation Geometry Algorithms Library (CGAL).  It's probably overkill for this problem, but it's still worth a look.

Restrictive Capacitive Touch Screen Guide

$
0
0
Recently at work we received MC40 mobile computers to perform inventory tasks.  Just one problem.  The interface was designed by Lucifer himself.  The image below shows the problem.  The on screen keyboard is located in the red area at the bottom of the screen and the scan button to read bar codes is shown as well.  Repeatedly moving your thumb back and forth between the two areas causes pain in the first joint of the thumb.  Ideally the keyboard should be at the top of the screen in the green area.  That way the thumb can move across without having to bend.

All of that wouldn't be too bad if it wasn't for the other issue, the custom on screen keyboard can be swiped to the left or right to get a full keyboard.  So when typing with your thumb bent back in an awkward position, if you move even slightly to the left or right while contacting the screen the keyboard starts to move left or right and the key press isn't registered.  The units the MC40 replaced were old, but they had physical buttons with audio feedback.  This made it easy type without looking at the keyboard.  The MC40 forces you to touch type like someone who's never seen a keyboard before.  If there was only one lesson to learn from technology over the last 10 years it's what Apple taught us, study how users interact with the product.  Put more than 10 seconds of thought into things.  I've partly already solved the problem by creating bar codes that automate common function that I used to perform on the keyboard.  At an estimate I've cut my key presses by about 95%.  Can we do more though?
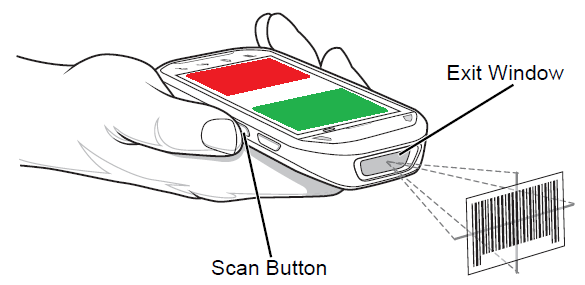
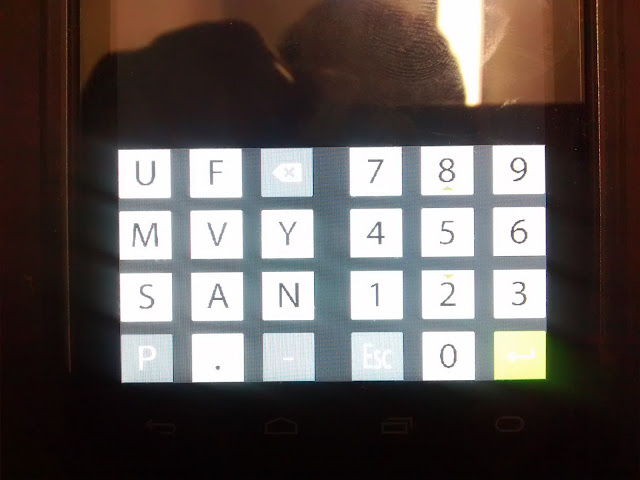
handheld computer
MC40 layout
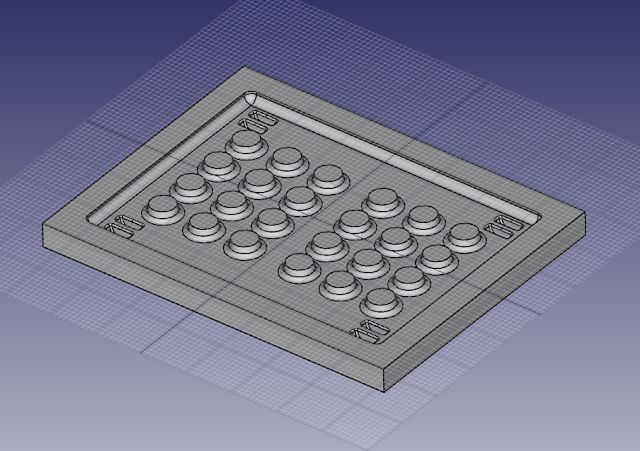
What's needed is a physical object to give tactile feedback of the button locations and limit the movement of the thumb when it touches the screen.  It's a capacitive touch screen so as long as I use a non conductive material I should be fine.  So what I plan to do is 3D print a guide that goes over the screen and is held in place by rubber bands.  It's a prototype just to prove a concept,  I could have had a PCB with holes made to do the same thing, but I want to try 3D printing.  It also allows me to add guides to hold the rubber bands. and round some of the edges.  As this part is designed to be touched, it can't have edges that will wear away at the skin.

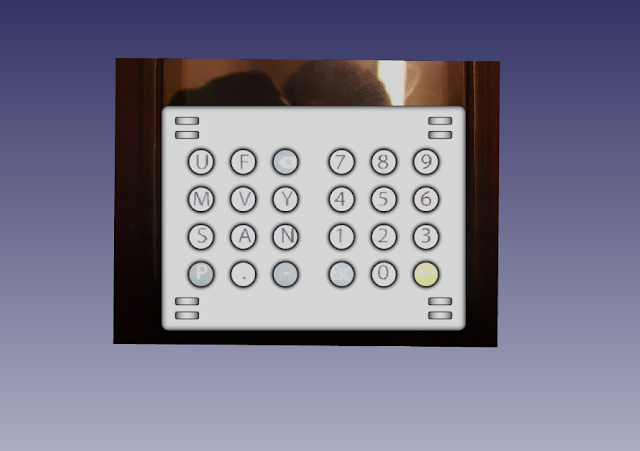
On screen keyboard
On screen short cut keyboard
I quickly realised that Sketchup wasn't up to the job.  I settled on FreeCad and I'm happy with it.  There was a week of swearing and watching video tutorials but I got up to speed after I figured out how parametric modelling works.  (Another thing to add to resume)  The result is below.

3D model
Touch-screen guide
When placed over the screen you can see how it's meant to work.  Two rubber bands that run between the guides at the top and bottom of the part hold it in place.  It allows you to feel where the buttons are without looking and it restricts the movement of the thumb so the keyboard cant start swiping to the left or right.  Imagine the hole in the end of a ruler, when pressing it with a thumb the skin protrudes the most in the middle.  This will be the contact point.  I'm not sure that I have the geometry right though.  If the holes are too big the structure will become weak, if they're too small the thumb won't fit through.  If the part is too thin it will break, if it's too thick the thumb won't touch the screen.  You can see that it will be sensitive to geometry.  Consider this a minimum viable product.  Once I have it I'll be able to make some informed iterations.

3D model
Guide in place over screen
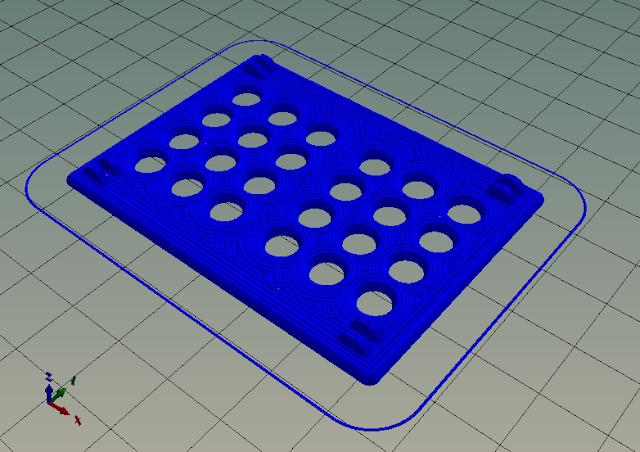
To see how the 3D printing would be completed I installed Repetier Host and sliced the model as a test.  I don't have a printer, a friend does, so I want to make sure I sort out any problems to make things run smoothly.

3D model
Sliced model
I then came up with another crazy idea.  What if I were to make a negative of the design and use it as a mould?  I could make rubber version of the design to prevent it slipping around the screen.  I'm no polymer expert, but some silicone RTV for gaskets from a local automotive store should do the trick for a prototype.  Just a thought.

3D model
Mould negative

I may appear to be down on the MC40, but the scan engine in that thing is a beast.  It's a newer (2012, that's new compared to most of our equipment) camera based design and it can read bar codes so fast you're not even sure you fully pressed the button.  The images are processed so quickly I'm 99% sure the algorithms it uses are in custom silicon.  I'd love to see how it works.

This isn't a project that needs to be done and 3D printing may not be the way to go, but at least I'll have some experience with 3D modelling and printing.  Excited.

Turning a Dash Cam into a Surveillance Camera

$
0
0
I've had to come up with a solution to a strange problem.  A relative thinks that someone is stealing their pot plants at night.  To see what's really going on a surveillance camera would be great.  The main problem is that most of the options on the market are just cameras that send an image back to central location for monitoring or recording.  This can be via a wireless connection or physical cables.  I don't want that, I want something really simple.  There's no internet connection or wireless network at this place, so that rules out a lot of options.  I can already hear people saying things like, Raspberry Pi, zone minder, WiFi dongle, IP camera, webcam.  Totally agree, if I was living there and had time to tinker, that's probably what I'd do, but this isn't one of those projects I'm doing because I love it, it just needs to get done.  Besides, I can see what would happen.  Project goal is to install a surveillance camera, spend a week in Linux trying to figure out why the webcam drivers don't work, or tracking down that the Raspberry Pi is restarting because the power cable isn't thick enough for the current it needs.  Screw that.

There is a far easier solution though, and luckily I had all the parts.  Take a car dash cam and power it from mains electricity though a timer.  Boom, done.  Well, not quite.

dash cam
Dash cam running on mains power
My father happened to have a spare dash cam he bought cheaply at ALDI.  It's not state of the art, but image quality is good, and it has some nifty features that will come in handy.  The display isn't of much use, but for aligning the camera it will be useful.

The plan is to have the timer come on at 6 pm and go off at 6 am.  This will active the camera in exactly the same way as turning on a car ignition.  Recordings that long will take up a lot of disk space, but luckily this model has a option to only record when movement is detected.  So most of the night the camera won't be recording anything.  If in the morning the relative suspects something has happened during the night, all they need to do is turn off the power to the camera.  I'll then inspect the footage when I'm available.

dash cam
Flip down display
The camera has 6 IR LEDs on the front that come on when it gets dark.  They seem to be rather good LEDs that don't bleed into the visible spectrum.  I can't imagine that they'll do much to illuminate a yard, but, we'll soon find out.

dash cam
IR LEDs
The original plan was to use a USB wall wart  from a phone to power everything, but as it turns out, the USB port is for charging and transferring data to a computer.  When a cable is plugged in the camera won't turn on.

dash cam
USB Port
To solve this I used a variable switch-mode power supply I had.  After testing the polarity and voltage of the power supply the camera came with, I replicated that with variable supply.  When connected to the camera with the appropriate plug everything worked fine.  Turn on mains power, and the camera enters standby mode read to capture any motion.

dash cam
Power Port
The timer doesn't really warrant a mention.  It's a simple mechanical timer that if needed my relatives are capable of setting.

The camera is now installed and waiting.  Let's see if we can catch this horticultural hijacker, blossom bandit, perennial prowler, seedlings stealer, leaf larcenist.  Sorry, couldn't help myself. :-)

A 3D printed Successful Failure

$
0
0
Sometimes things don't work out the way you plan, but learning from failures can be valuable.  I'm referring to the restrictive capacitive touch screen guide I designed a couple posts ago.  It didn't work, but the interesting thing is that it failed in a way I didn't expect.

3D printed part
Touch screen guide
First, a quick refresher for anyone unfamiliar with what I was trying to do.  I use a mobile computer with a touch screen at work and it's remarkably difficult to use.  A lot of my tasks would go quicker if I could type without looking at the screen, but that's impossible with a touch screen.  This was an attempt to add some  tactile feedback to the process.  I'm going to be a tease and leave why it didn't work, or at least my assessment of the failure until the end of this post :-)  First let's look at 3D print itself.

3D printed part
Raw Print
As you can see from the image above, the print came out a little rough.  I had a friend print it for me on his printer, and as this was my first print, I don't have a lot of experience with the finer details of the process.  It was a new roll and the machine was still being dialled in and after some reading it looks like the feed rate of the PLA filament was a little high..  The inner layers that were something like 70% infill worked quite well, it was just the solid surface layers that were rough.  I think this means that on the inner layers the excess filament had somewhere to go, whereas the surface layers were doing something like 105% infill for example.  No biggie, this can be cleaned up.

3D printed part
Rough holes
I made the holes a little smaller than they needed to be.  They can be expanded to the right size later on.

3D printed part
Rubber band guides
The semicircle guides that hold the rubber bands in place worked out well.  They could've been maybe 0.5 mm higher and 0.5 mm further apart.

3D printed part
Bottom of the guide
The bottom of the part came up well, but was a bit hard to remove from the heated build plate.

3D printed part
Cleaned up part
After filing and sanding the part, the holes were expanded to a size to allow a thumb pressing on them to touch a screen beneath.

3D printed part
Holes merging
In the image above you can see that the holes are almost as big as they can get.  Any larger and they would start to merge.

3D printed part
Tapered holes
The holes were tapered to leave a decent amount of plastic at the bottom, making the part rigid.  This is acceptable as the hole doesn't need to be as large at the bottom.

When tested, the device fit the screen perfectly and the rubber band held it tin place as it was designed to, but the screen wouldn't register button presses.  This is in contrast to tests performed on my tablet where the screen was registering presses in random locations.

So what went wrong?  Relative permittivity, I think.  Touch screens are designed to detect presses from a watery finger surrounded by air.  It's hard to find data, but the relative permittivity of PLA plastic is around two while air is one.  It may not sound like much, but the screens are calibrated to work in air, not under a large piece of PLA plastic.  A structure like the one I designed changes the electric fields the capacitive screen expects to see and basically confuses it.  It's an interesting failure mode.

Now let's think of ways around that.  Reduce the amount of plastic to minimise the effect it has on the screen.  This can be done by changing thickness, infill or adding extra holes.  All of these option make the part weaker though.  What about a plastic that has a low relative permittivity?  Unfortunately it doesn't get too much better than this.  You could add small bumps to move it away from the screen and make it thinner.  This then makes it harder to manufacture.

I think there's a possibility of making a working version.  You could iterate on the geometry to until a solution was found but as this was for a bit of fun I'm not going to try.  It's also hard to compensate for the different finger and thumb sizes of people.  Besides, the powers that be have acknowledged that the on screen keyboard is a hot mess and have redesigned it.  Unsurpisisngly it's still terrible, and it doesn't solve the problem of tactile feedback.

If I were to pursue this further my next step would be an electronic solution.  (What a surprise I hear you say.  When all you have is a hammer, everything looks like a nail)  Turns out that the scanner has a micro-USB port that you could plug a keyboard into.  It's also possible to plug in something like a custom PCB with an array of rubber membrane switches on it.  I'd also add some audio feedback so I know a button has been pressed.

You may think that I'm obsessing about this, but this has turned what used to be a 5 second job into a 10-15 second job.  Then consider that this task is done around 50-100 times a day, by 3 or 4 staff in 700+ stores.  It's worth hiring a designer to iron out the interface and make the process simpler.

So in summary it was a successful failure.  The form factor and my physical design worked as I had planned but the overall concept was flawed.  Anyway, I'm now thinking about more things I can print.

Visualizing Periodic Order Schedules

$
0
0
I've been grappling with a problem involving order schedules and thought a visualization may help to understand the problem better.  There just doesn't seem to be an existing graph that satisfies all my criteria.  Before I go to far it may help to explain my situation.  Imagine a system where weekly repeating orders are placed, and each of these orders go through several stages of fulfilment.  For example, here is an order placed every week on Friday.

Friday - Order Placed 
-on order-
Saturday - Order Delivered
-on hold-
Sunday - Stock placed on show for sale
-on show-
Tuesday - Check remaining stock and investigate overstocks
-overs-

This seems simple to understand, the order is placed and is considered "on order", once it's delivered it's put "on hold" until it's checked to make sure the delivery is correct.  Once placed on show for sale it's considered "on sale".  After the next load arrives any remaining stock is considered to be an "over" or overstock.  Not too hard.  Now imagine you have many of these orders during a week and they all overlap.  It starts to become confusing.  A traditional way of displaying this might be in the form of the graph below.  It's certainly clear, but the cyclic nature of the orders isn't displayed.  For example, the order at the top should be entered again starting at the second Friday column in the graph, but this makes it look like you have more orders that you really do.  Is there a better way?

Linear order graph

The cyclic nature of the orders suggest that a circular graph may be useful and with a bit of playing around I came up with the visualization below.  The first event in an order sequence is mark on the outer part of the graph, it then spirals inwards indicating the different stages of the order process with different colours.  It's advantages are that orders only need to be added to the graph once and it allows the user to see the current state of all orders.  The graph below contains 5 orders and is easy to read once you understand how it works.


Circular order graph
Time for an example.  Let's say that on Tuesday at 6 pm you are curious about stock levels.  You start by drawing a line from the centre at this time on the edge of the graph.  You can see that the line crosses a green line, this indicates on show stock, it crosses a yellow line, this indicates on hold stock, and it crosses two red lines, both of these are orders that have been placed and not delivered.  If you want know the time the next load is delivered, rotate the line forward, until one of the red lines turns yellow.  This happens around midday Wednesday.

You may also want to know the history of the stock on show.  That's also easy, just follow the green line backwards.  Events mentioned are labelled with a black dot. You can see that the stock became available for sale on Sunday morning, arrived midday Saturday, and was ordered Thursday morning (that's a pretty long lead time isn't it).  For completeness the blue line indicates overstocks, and as this is the last stage of the order process and doesn't really have an end time, the line will fade out over two days.

Another interesting feature is that you can immediately see when an order for stock was placed by looking at the white grid lines.  Look at where the black line crosses the yellow line.  It's 4 and bit divisions from the edge of the graph.  This means that order was placed 4 and bit days ago.  You can confirm this by following the line back to see that this order was placed on Friday morning.

It's just a prototype and the colours need to be tweaked.  You could also make an axis logarithmic to emphasise certain data.  I like it.  It reminds me of a Smith Chart.

I've put the python code I used to generate this in  gist.  It's not pretty and should just be used to get you started.


https://gist.github.com/GrantTrebbin/e09f776c8eba449de57e
Get the code!

Soylent OCR - Computer Assisted Human Based Data Entry

$
0
0
Can software help a human process images faster than a computer when you take into account the time setting up the image processing pipeline?  That's the intent of "SoylentOCR - It's made out of people".  It's a python-tkinter based program that can help with small data entry or image classifying tasks.

For the last few years several people have tried to predict the results of the Triple J Hottest 100 song poll by analysing images of votes placed on social media.  Their predictions are usually pretty good, but when they do get it wrong it's because of some quirk in the optical character recognition (OCR) process.  That's not a criticism, OCR is hard.  What's that I hear you say?  OCR is a solved problem.  Yeah, it kind of is, but it all depends on the quality of the source images, the accuracy required, and how you train the software and post process the results.  This is definitely a case where the quality of the source images is less than ideal as demonstrated below.

ballots
4 different sample ballots found online

In this situation, if you had to process one million images, you'd probably spend time training your software to recognise particular fonts, and writing post processing software to make sure the results are accurate.  If you had one image to process you'd probably just type the results in manually.  My points is that somewhere between these two extreme cases there is a cross over point.  I don't know where that is, but I'd like to explore improving the manual entry option.  One of my favourite XKCD comics illustrates this point.  Sometimes spending time to make a task more efficient doesn't make sense.  It's quicker in the long run to just do it inefficiently.

xkcd
I think of this XKCD often.  Is it worth the time?
To improve the process I came up with a program that displays the images in a frame and allows data entry in multiple entry boxes in a second frame.  As you type, suggestions for what you are trying to enter appear in the third frame.  To move forward and backward though the images to be processed you use tab and shift-tab.  Moving between entry boxes is done with the up and down keys.  A status box also shows your progress.

When entering data into an entry box, it's split into words at spaces.  The first 10 entries containing all of these words are displayed as suggestions.  One of these can be selected to fill the entry box by pressing the control key along with the number of the suggestion.  You can see in the image below that typing in "el in pa" is enough to make "paper kites the electric indigo" the top suggestion.
User Interface
soylentOCR user interface
When first started, the database contains no suggestions at all, but these are slowly built up when data is entered.  Any entry that is not a suggestion becomes ones when you move to the next image.  To further improve performance, the suggestions are in the order of the most common ones previously entered.  Although it's possible to start with a completely empty database, it helps to "prime" it, by adding a list of suggestions from elsewhere in a database editor.  These can be ignored in the final analysis.  The sqlite3 database contains one table with columns titled:

FILE_NAME, ATTRIBUTE_NUMBER, ATTRIBUTE

There is a combined primary key over the FILE_NAME and ATTRIBUTE_NUMBER columns.  To help my example I found a list of eligible songs, converted it to lower case, replaced any character that wasn't a letter, number, or space with a space (Notepad++ is awesome).  I also added approximately 20 songs from a betting website that were predicted to win.  This means that these songs are now already in the database twice and appear at the top of the suggestion list.  This is done as they are most likely to appear when entering data.  A set of training data that complies with the table format was created in a spreadsheet, saved as a CSV file, and imported into the database.  It sounds complicated but it isn't.

database browser
Training data imported into SqliteBrowser

The code isn't perfect.  For example the directory containing the images is hard coded into the software.  It also treats all files in that directory as images.  When it encounters one it can't open it shows a red square and places a notification in the status box.

User Interface
Not an image notification

All that's left now is to sit down and try it out.


To process the 76 images in that directory it took me 1:25:41.  That averages about 67 seconds per image.  Not as good as I was hoping.  Earlier tests of just typing the data in notepad gave results of about 90 seconds per image.  So yeah, it's an improvement but not much of one.  I did however get a better feel for the problem and have some ideas about how to improve the software.

First of all, 10 suggestions are too many.  It turned out to be much easier to type until there were only one or two suggestions and then select one.  The other issue was that most of my time was wasted while my eyes were going back and forth between entry and suggestion.  My original intent was to have the suggestions appear under the entry boxes, just like Google does when you enter a search term.  This means you only need to look in one area.  At the time I was a beginner with tkinter and had no idea how to do what I wanted.  I think I may know now so I'll give that a try.

To make the results more rigorous this would be better implemented as some sort of web app.  Multiple people could log in and be assigned images to process using a shared database.  Each image could be processed at least twice by different people and the results compared.  If they don't match there's an error

So overall I'm happy with the result.  I learnt tkinter, and did achieve a reduction in the time required to enter the data from an image.  Unexpectedly it became clear that the program could be used for other purposes.  Imagine you were doing some landscaping and you wanted to choose plants for a garden.  If you had images of all the plants it would be trivial to go through and rate them 1-10.  This is a task that a computer just couldn't do because it's your own personal opinion.

Get the code!

Improved Computer Assisted Human Based Data Entry

$
0
0
OK, I'm revisiting my post from last week.  I was certain that I could reduce the time it took to enter data with some simple modifications.  The results are at the end. The main change was the removal of the suggestion frame from the right and its replacement with a suggestion label positioned under the box that's currently in focus.  Take a look at the previous version to see the difference.   Another change was that previously pressing enter while in an entry box had no effect.  Now it selects the first suggestion and moves focus to the next box down.

These changes reduce the number of keypresses and the amount of scanning that your eyes need to do of the on screen data.  I was also feeling a little nostalgic, so I've chosen some 4-bit colours for different elements. :-)
tkinter window
Data entry with suggestions

The window is broken into two different frames, divided at the blue line, one on the left for the image to process, and one on the right for the entry boxes and the status label.  The second frame in arranged into 11 rows, divided at the red lines, with the grid manager.
tkinter window
Arrangement of input window

The hard bit however was getting the suggestion label to be placed under the entry box.  First of all, a few things need to be discussed in the image below.

The frame is divided into 3 columns indicated by the blue lines.  This allows small coloured indicators besides the entry box to indicate which one has focus.  This is done because ttk entry boxes don't allow the background colour to be changed.  The small coloured regions are fixed size and the entry box is allowed to resize to fill the rest of the space.

The next step isn't as simple as placing a label under the input box.  First a frame needs to be inserted with the place manager that's underneath the entry row and is the same width.  This frame is outlined in yellow.


self.suggestion_frame.place(relx=0,
                            rely=1,
                            relwidth=1,
                            bordermode='outside',
                            in_=self.entry_rows[row_number].entry)


This then has the suggestion label inserted in the frame.  The label stops at the green line.

self.suggestion_label.grid(in_=self.suggestion_frame,
                           column=0,
                           row=0,
                           sticky='nsw')


I hear you say that's weird, why not just add the label under the entry box, why use a frame?  It's because of how tkinter handles long lines in labels.  I construct a string of text to add to the label that contains carriage return characters (\n).  This usually works for small lines, but for long lines, the string is cropped to make it fit the label.  It doesn't realise that the carriage return characters start a new line.  Fox example, the string 

really long text part one \n really long text part two \n really long text part three

would display correctly on three lines if the label was wide enough.  However if the label was only wide enough to display 4 characters, it would display "real" once and then crop the rest of the text before it gets to the carriage return characters.  What you probably expected to see was:

real
real
real

The way to get around this is to create a frame of the correct width and then place a label in it that has no set width.  The label will then resize to a width to fit all the text, while the frame acts to crop the text limiting what's shown.


Suggestion label
So did the entry speed increase?  Yes it did.  In my last post I noted that typing the text with no assistance took about 90s per image.  My first attempt took 1:25:41 for 76 images or 67s per image.  This new arrangement allowed for a time of 1:07:26 for 76 images or 53s per image.  I'm pretty happy with that.  That's a 40% decrease in the input time from unaided and a 20% decrease from the initial attempt.  Although I'm likely to get faster the more I type the data, the tests were a week apart so I think this effect is minimal.


Get the code
.

Merge Sort... Sort Of

$
0
0
I have a project in mind that requires a sorting algorithm.  That's easy enough, there are plenty of them out there, the problem I have is that I want to be able to save the state of the sort part way through and resume it later.  The easiest way to explain the solution I devised is to show an example sort in the animation below and then explain it.  First understanding Merge Sort will help as well.

Sorting Animation
Custom Merge Sort

I haven't really changed much.  I've just implemented Merge Sort in a simple way.  More specifically in a list of lists.  The basic principles of a Merge Sort are still there.  At every stage all sub lists remain sorted and merging two lists is done by comparing the smallest elements of the two lists.

In the animation above, 11 numbers are sorted.  To start, 11 lists that contain only one number each are created to store the numbers to sort.  These are contained within another list that has another empty list placed at the start.  This empty list is called the auxiliary list or List 1.  From this point on the process is simple, merge List 2 and 3 into List 1.  Once this has been done, move the new large list to the end of the outer list. Each time this process is repeated, the number of lists is reduced by one until only one sorted list remains.  It also ensures the the lists are always ordered by the number of elements they contain.  Large ones at the end, smaller ones near the start.

The reason I like this method of sorting is that it's easy to pause the sort, save the state, and resume it later.  All you need to do is save a lists of lists.  You don't need anything else.  When resuming, the next move to make can be determined by looking at the first three lists and seeing if they contain any elements.

Sorting State
It's not ground breaking, and merge sort has probably been implemented like this before, but I found it to be a simple way to go about doing things.  I've mentioned lists throughout this post, but as the program I want to write is likely to be in python, I'll probably use a deque of deques to hold the data.

On another topic, my original plan way to make a nice fancy animation to explain things that had nice transitions, but I just couldn't pull it together in time.  I thought I could find a software package to do it and ended up with Synfig, but that went nowhere.  What kind of program freezes because you have a font installed it can't read.  Some error handling would be nice.

I eventually started hand coding an animated SVG and that showed promise, but it was a bit clumsy and I didn't really have a work flow established as you can see in the image below.  I think I've finally come to a solution that involves d3.js and all that's associated with it.  Fingers crossed.

Animated SVG Development
Makeshift animated SVG IDE


Just for fun, let's speed things up. :-)

Sorting Animation
Fast Custom Merge Sort

.

Smart TkInter Image Manager for Labels

$
0
0
Just a quick post today.  I've been working on a piece of python software that's tkinter based that requires images to be displayed.  My preferred way of doing this is to use a tkinter.ttk.Label to hold images, but they're aren't very flexible.  To overcome this I wrote a subclass of the tkinter.ttk.Label called TkLabelImage.  It allows images to be easily loaded and displayed by labels while controlling their quality and behaviour when resized.

In the example below a TkLabelImage object is created, it's image behaviour is set, and the file name is specified.

        self.label1 = TkLabelImage(self.frame1)
        self.label1.image_behaviour('dynamic', True, 500)
        self.label1.load("test.png")

The first line creates a TkLabelImage object that's a child widget of self.frame1.  After that, the behaviour is set on the next line.  The first argument refers to the image quality desired when the image is resized.  'low'  will resize the image without anti-aliasing, 'high' will use anti-aliasing, and dynamic will resize the image without anti-aliasing, and after a delay in milliseconds defined by the third argument will do a final anti-aliased refresh.  This means that windows can be resized smoothly by only rendering lower quality images when the resize is occurring, but as soon as it's complete a higher quality image is refreshed.  The second argument specifies if the aspect ratio of the image should be preserved.  When the configure event of the main program is called, the following method is called to refresh the image.

        self.label1.fill()

The image below is a demonstration of this.  The window is split into two frames that each hold a label.  Each label displays an image.  The first has aspect lock on while the second doesn't.
tkinter window
Comapre the effects of aspect lock

The window below shows the effect of anti-aliasing on the image.  The first image uses it while the second doesn't.
tkinter window
Compare the effects of anti-aliasing

I am by no means a python expert I'm sure there are many things wrong about how I've implemented my solution.  It works for me though.  I'd love if someone who was more skilled took the idea and ran with it.

https://github.com/GrantTrebbin/sortamajig/blob/master/tklabelimage.py
Get the Code!

.

A Python Sorting Manager With A Human Comparison Operator

$
0
0
Nothing too exciting in today's post.  I've created a SortingManager class to implement the sorting algorithm that I mentioned in a previous article.  Unlike most sorting algorithms it doesn't have a way to compare things.  When the manager gets to a point in the sort that require two items to be compared, it'll wait for user input.  This means any object can be sorted, and things that can't usually be compared by a computer can be sorted.  For instance you could supply a list of baby names and use the sorting manager to order them.  To illustrate this I've used a random arrangement of the numbers 1-10.

The first step is to create a deque containing each item and then place all of these deques in another deque.  There also needs to be an empty deque at the start.  This is demonstrated in the example below.  The word deque has been replaced by the letter d to make things more readable.

d([d([]), d([4]), d([10]), d([1]), d([8]), d([5]), d([2]), d([9]), d([3]), d([6]), d([7])])

A sorting manager object is then initialised with this deque.  In this case the deque to sort is called toSort.

sm = SortingManager(toSort)

At this point calling sm.options will return 2 elements in a list to choose from.  Based on your sorting metric you then select one of these by calling sm.select(n), where n is either 0 or 1.  This means you can sort based on obscure things like the best baby name, the nicest font, or the most beautiful flower for a garden.  You can also sort based on conventional things like smallest number.  For most sorting algorithms you have to supply a comparison operator for the objects you're sorting.  In this case YOU are the comparison operator.

This process is repeated until the list is sorted.  If you happen to make a mistake call sm.undo() and this will take you back a step in the sort.  There is also sm.redo() in case it's needed as well.  sm.sorting_state will let you see the the internal state of the object.  This can be saved to file and reloaded later if needed.  sm.progress allows you to know how much of the sort is completed. it return a list of 2 numbers.  The first is the maximum number of comparisons yet to complete, the second is the maximum number of comparisons is the list was completely unsorted.

I get that this may be little hard to understand.  To help you out I've written a test program that sorts the numbers in the deque above.

The output of test.py is listed below.  The internal state deque is displayed, the amount of the sort remaining is shown as a decimal, and then the options to choose from are shown in square bracekts.  My choice of the 1st or 2nd option is shown after the > character.  There is purposeful mistake near the end to demonstrate the undo command.

enter
1 for option 1
2 for option 2
8 for undo
9 for redo

d([d([]), d([4]), d([10]), d([1]), d([8]), d([5]), d([2]), d([9]), d([3]), d([6]), d([7])])
100.0
[4, 10]
>1

d([d([]), d([1]), d([8]), d([5]), d([2]), d([9]), d([3]), d([6]), d([7]), d([4, 10])])
96.0
[1, 8]
>1

d([d([]), d([5]), d([2]), d([9]), d([3]), d([6]), d([7]), d([4, 10]), d([1, 8])])
92.0
[5, 2]
>2

d([d([]), d([9]), d([3]), d([6]), d([7]), d([4, 10]), d([1, 8]), d([2, 5])])
88.0
[9, 3]
>2

d([d([]), d([6]), d([7]), d([4, 10]), d([1, 8]), d([2, 5]), d([3, 9])])
84.0
[6, 7]
>1

d([d([]), d([4, 10]), d([1, 8]), d([2, 5]), d([3, 9]), d([6, 7])])
80.0
[4, 1]
>2

d([d([1]), d([4, 10]), d([8]), d([2, 5]), d([3, 9]), d([6, 7])])
76.0
[4, 8]
>1

d([d([1, 4]), d([10]), d([8]), d([2, 5]), d([3, 9]), d([6, 7])])
72.0
[10, 8]
>2

d([d([]), d([2, 5]), d([3, 9]), d([6, 7]), d([1, 4, 8, 10])])
68.0
[2, 3]
>1

d([d([2]), d([5]), d([3, 9]), d([6, 7]), d([1, 4, 8, 10])])
64.0
[5, 3]
>2

d([d([2, 3]), d([5]), d([9]), d([6, 7]), d([1, 4, 8, 10])])
60.0
[5, 9]
>1

d([d([]), d([6, 7]), d([1, 4, 8, 10]), d([2, 3, 5, 9])])
56.0
[6, 1]
>2

d([d([1]), d([6, 7]), d([4, 8, 10]), d([2, 3, 5, 9])])
52.0
[6, 4]
>2

d([d([1, 4]), d([6, 7]), d([8, 10]), d([2, 3, 5, 9])])
48.0
[6, 8]
>1

d([d([1, 4, 6]), d([7]), d([8, 10]), d([2, 3, 5, 9])])
44.0
[7, 8]
>1

d([d([]), d([2, 3, 5, 9]), d([1, 4, 6, 7, 8, 10])])
36.0
[2, 1]
>2

d([d([1]), d([2, 3, 5, 9]), d([4, 6, 7, 8, 10])])
32.0
[2, 4]
>1

d([d([1, 2]), d([3, 5, 9]), d([4, 6, 7, 8, 10])])
28.0
[3, 4]
>1

d([d([1, 2, 3]), d([5, 9]), d([4, 6, 7, 8, 10])])
24.0
[5, 4]
>1

d([d([1, 2, 3, 5]), d([9]), d([4, 6, 7, 8, 10])])
20.0
[9, 4]
>8

d([d([1, 2, 3]), d([5, 9]), d([4, 6, 7, 8, 10])])
24.0
[5, 4]
>2

d([d([1, 2, 3, 4]), d([5, 9]), d([6, 7, 8, 10])])
20.0
[5, 6]
>1

d([d([1, 2, 3, 4, 5]), d([9]), d([6, 7, 8, 10])])
16.0
[9, 6]
>2

d([d([1, 2, 3, 4, 5, 6]), d([9]), d([7, 8, 10])])
12.0
[9, 7]
>2

d([d([1, 2, 3, 4, 5, 6, 7]), d([9]), d([8, 10])])
8.0
[9, 8]
>2

d([d([1, 2, 3, 4, 5, 6, 7, 8]), d([9]), d([10])])
4.0
[9, 10]
>1
-sorted
0.0
d([d([]), d([1, 2, 3, 4, 5, 6, 7, 8, 9, 10])])


You're going to have to trust me that I'm heading somewhere with this.  As of the time of writing I still need to comment the code and tweak a few things, but stick with me, it's all part of a larger project.

Get The Code!


.

Visually Appealing Image Layout Algorithm

$
0
0
Let me pose a problem.  If I were to give you a number of randomly sized images that needed to be  displayed in order, in a row with a set width, how would you do it?  To make things slightly more complicated, you're not allowed to crop the images either.  What's the most visually appealing way to arrange and size the images?

This question came about as I was trying to display the results of another program I wrote.  My goal was to take a number of images, scale and place them in rows in a specified order to fill an image of a certain size.  My first attempt was based on a blog post theorizing about how the image layout algorithm for Google Plus works.  The described algorithm is quite simple.  Start with a single image and scale it to fill the required width.  After scaling, it will have a certain height.  If the resulting row is too high, add another image and scale them so that they are the same height and their total width is what you require.  Keep repeating this process until the row is the right height.  The equation below describes how to find the height of the row.

You can see from this that as you add another image, you add another w/h term to the denominator of the fraction.  As this will always be a positive number, the row height will decrease each time you add an image.  Let's have a look at my first attempt using this method.

Image Gallery Test
Pretty snazzy huh?  Wait a minute, what's going on in the first couple of rows?  All of those dots are actually images, and do you know why they look like that?  Remember how adding a new w/h term decreased the row height?  Adding an image with a large aspect ratio adds a very large w/h term.  In this case, the long thin image added last causes the row size to drop to around a single pixel high.  That's far from ideal.  On the plus side, for images with relatively normal aspect ratios, this algorithm does a good job.  It seems to be the basis for the jQuery plugin, flexImages from Pixabay.  I should add that the images above need to be padded better to make sure that they line up on the right hand side, but that's a trivial step for later.

Where do we go from here?  The dimensions still satisfy our requirements that all images have the same height, and that the total width be a specific number of pixels.  After looking at a lot of image galleries online and thinking about it intensely for a week, I came up with a formal definition of the problem.

Formal definition of the problem
It doesn't look like much, but it gives us a framework to solve the problem.  One subtle point to notice is that alpha is between 0 and 1.  This means that images should never be enlarged.  I believe that enlarging images to fill empty space is the wrong way to go.  If a 1x1 pixel image was added, enlarging it to fill a 100 pixel high row doesn't add any information, all it does is take up 100 pixels of horizontal space that could be used for images that do have information.  Besides, enlarged images never look good, they always come out blurry, regardless of the interpolation method used.

Looking at the definition above it becomes clear that we are trying to solve for the values of alpha.  We know alpha is bound by the values 0 and 1.  We also have to obey the constraint that the total width of the scaled images is equal to some value W.  Conveniently this is easily fed into the minimise function of the scipy.optimise Python library.  Using the SLSQP method, non linear constrained optimization problems can be solved.

Some of you may have rightly noticed that my definition of the problem doesn't solve anything.  Optimization algorithms require an objective function.  This is the function that is minimised in the optimisation process. This is the part I've been struggling with.  The best that I've come up with so far is to try and minimise the sum of the standard deviation of the heights of the scaled images and the standard deviation of the widths of the scaled images.  i.e. (std(heights)) + (std(widths)).  To test this method I've written a program that takes images sizes and tries to make a row out of the dimensions.  The output is displayed as black images on a white background.  The results aren't too bad.


Image row optimization first pass

You can see in the image above that none of the images dominate the row and all get a reasonably fair proportion of the display.  The tiny image at the end remains that size because it hasn't been scaled up, which is one of the bounds.  Ideally I'd like all the image to be the same height.  So I took the results of the first pass and fed them back thought the optimisation process.  This time however, the bounds are set to be within 85 to 115 percent of each of the values of alpha for the first round, still bound by 1 on the high side.  The optimisation function has also been changed only to minimize the standard deviation of the height, not the width.

Image row optimization second pass

That's as far as I got.  I think the second layout looks better.  I may need to walk away from this one for a while and think about what I'm trying to optimise.  That's the trick, coming up with the right optimisation parameters.

I've really enjoyed playing around with this.  This is one of those experiments that I can indulge in because I'm not doing this as a job.  I can take the occasional detour and explore interesting topics just because I want to.

https://github.com/GrantTrebbin/sortamajig/blob/master/optimiser.py
Get the Code


In case anyone else is interested in this problem I've collected some links to sites that have relevant information.

A good description of the different types of layouts used
http://blog.vjeux.com/2012/image/image-layout-algorithm-facebook.html

http://blog.vjeux.com/2012/image/image-layout-algorithm-lightbox.html

http://blog.vjeux.com/2012/image/image-layout-algorithm-lightbox-android.html

http://blog.vjeux.com/2012/image/image-layout-algorithm-500px.html

http://blog.vjeux.com/2013/image/image-gallery-left-and-right-areas.html

http://blog.vjeux.com/2014/image/google-plus-layout-find-best-breaks.html

A different layout that can use snapping
http://www.greentreelabs.net/isotope-masonry-tiles-gallery-and-final-tiles-gallery/

A layout algorithm that uses cropping
http://www.techbits.de/2011/10/25/building-a-google-plus-inspired-image-gallery/

Unique 2D Barcodes with Orientation Detection

$
0
0
A friend of mine is studying to be a teacher and was recently explaining how she uses a service called Plickers to administer multiple choice tests in classes.  Every child gets their own square matrix style barcode on a card approximately 100mm x 100mm (that can vary though).  Each side of the code is labelled with the letters A, B, C, or D and when a question is asked, the kids hold up their card with the letter that corresponds to their answer at the top.  The teacher then uses an app to scan the class, recording each child's answer.  It works because the set of cards provided are unique no matter what orientation they are viewed in.  It's quite a clever idea, not only can the software say "that card belongs to student X", it also knows what side is pointing up.  The cards can be downloaded from the website in sets of up to 63 cards and look like this.

barcode
Code 47

When I heard 63 I immediately thought that somehow the number of cards was related to 2^6 - 1, but that was just a hunch.  Let's actually work out how many cards are possible.

Each code is made of a 5x5 grid of black and white squares.  By looking through them, you soon notice that the centre square is always white and the 8 surrounding it are black.  This is most likely similar to the finder pattern in QR codes.  The 4 corner squares are always black as well.  This means that a bounding box for each code can be easily found.  Both of these features make it easier for the the image recognition algorithms to locate and identify each code.  The 12 squares remaining are used to encode data.  These are shown below as blue squares.

barcode
Plicker Code Layout
In the image above you can see that each side has three data squares, allowing each set of three to be coloured black or white 8 different ways.  From this point on in the analysis instead of refering to individual squares I'll just refer to the decimal encoding of bits on each side.   For instance, code 47 above can be described as (2,4,5,5) starting at the top, going clockwise and assuming white squares and 0 and black are 1.  As there are 4 different orientations for the card you could also describe it as (4,5,5,2) , (5,5,2,4), or (5, 2, 4, 5).

For this system to work, you need to be able to determine what side of a card is facing up.  If a card looks the same after rotating it either 90, 180, or 270 degrees, it's useless.  What conditions need to be met to ensure this?  Lets take a card with the encoding (a, b,c d) and rotate it 90 degrees to obtain the card (d, a, b, c).  If these two orientations are to be confused (a, b, c, d) is to equal (d, a, c, d).  In the image below you can see that only way that this can happen is if a=b=c=d.  A symmetrical argument can be made for rotation of 270 degrees.

rotations
Rotation by 90 degrees

What if the card (a, b, c, d) is rotated 180 degrees to get the card (c, d, a, b)?  This time things are a little different.  The only way the two orientations can be confused is if a=c and b=d.  This can be seen in the image below.

rotations
Rotation be 180 degrees

So to make sure that the orientation of a card can be determined, all we need to do is  make sure that the cards aren't rotationally symmetric by 180 degrees.  This covers the cases of rotation by 90, 180, and 270 degrees.  This means the the first two positions can contain any data we want.  This gives rise to an n squared term.  To make sure that the cards aren't rotationally symetrtic, the last two positions can also contain anything we want, except for them being equal to the first two positions.  This gives rise to an n squared minus one term.  This gives rise to an equation of the number of orientations possible.

equation

Dividing this by 4 gives an equation for the number of unique cards possible.  This is because each card covers four different orientations.

equation

In this case n is equal to 8 (2^3) as there are 8 different ways to arrange the squares on each side.  This means there are 1008 different possible cards.  So why do they only use 63 of them?  Your guess is as good as mine.  Maybe they have another condition to make sure that cards have a certain number of differing squares to minimise the chances of cards being misidentified.  Maybe their software only uses one byte to store each scanned card, 6 bits for the card and 2 for the orientation.  Who knows.

I'll just point out that by expanding that equation above, we can easily see that the result will be an integer for any integer input.  If n is even, the n squared term is divisible by 4, if n is odd, (n-1) (n+1) is divisible by 4.

equation

You may also ask why they didn't use QR codes?  Uniqueness of codes is easy and orientation can be determined simply.  A rule of thumb for scanning QR codes with a phone is that you can only scan codes that have a width equal to one tenth of your distance from it.  So lets say a teacher is 5 meters from a student, the code would have to be 50cm wide.  That's too big.  This is because QR codes have a lot of detail.  The Plickers codes are small enough to fit inside the large finder pattern on a QR code.

It'd be interesting to see if it's possible to allow more than 4 options for multiple choice questions.  Maybe holding the card at 45 degrees like a diamond could allow this.  Just a thought.

Bit Reversal Permutation Access

$
0
0
It'll take me a while to get to my point, but stick with me.  Recently while I was waiting for a train, a freight train passed the station and I came up with an interesting thought experiment.  I wondered "where is that train going, what does its journey look like, and how could I find out?"  It's relatively simple to just Google the answer or look up satellite maps of the trains tracks, but that doesn't tell you information about where it was at what time, what speed it was doing, or something a little stranger like weather conditions.

Note: Before I get into things, I should point out that this is just a thought experiment.  Sometimes I like to think of problems and try to solve them just to keep my mind busy when I'm bored.  Sticking a random piece of electronics to a train would be a dumb and potentially dangerous thing to do.  Don't be stupid.  Now, on to the problem at hand.

I wondered could a tracking device be attached to the train to take readings and report back?  Of course it can, there's nothing too complicated about that.  A few sensors, a single board computer, a battery, and some powerful magnets to hold it in place and you're done.  But how does the data get back to you?  At the moment the Raspberry Pi 3 is the new hotness in the maker community and it comes with built in WiFi.  As the train makes its way across the countryside, instead of using the mobile phone network to return the information could the data be transmitted back to the user by latching on to fleeting connections to the internet via open WiFi hotspot, kind of like a monkey swinging from vine to vine in the jungle. #LabouredSimile

Now an arrangement like this where you have unpredictable and limited connection to the internet means you have to transmit the data in the most useful way possible.  Let's say the data is stored in regularly sampled records, what's the best order to transmit those back?  Well, the first thing I want to know is where the train is now.  The next most useful thing to transmit back isn't the next record, because it won't differ that much from the previously transmitted record.  What you really want next is the record half way between the start and the previously transmitted record.  This will fill in the missing data in a way that gives you the most useful information first.  If we continue this pattern you just keep filling in the records that are midway between the ones transmitted previously.

I thought about it and realised that if you have an incrementing binary counter, almost all you need to do is reverse the order of the bits in the counter and access the records in that order.  That gets you most of the way there, unfortunately it gives you the oldest data first.  To fix that, just invert the bits.  That sounds pretty complicated, but hopefully the animation below can hep you out.  It assumes we have 16 records to transmit and demonstrates the "In Order", "Reversed", and "Reversed & Inverted" methods.

Data Animation
Bit Reversal Permutation Access

You can see that the "Reversed & Inverted" method returns the data in the order required.  It returns the newest data first and keeps returning records in between already returned records.  After a bit of Googling I discovered this is called Bit Reversal Permutation, and is used in the process of calculating Fast Fourier Transforms.

There are a lot of assumptions in my scenario, like adequate WiFi strength, and power of two records.  It's just a bit of fun that as it turns out has a real world application.

Putting The Back On A Watch

$
0
0
Ever taken the back off a watch and you didn't know how to get it back on?  Ideally you'll want to find a watch press that has the correct size dies.
Watch Press
Watch Press
But, in a pinch, you can use a normal vice.  I have to warn you though, if you're not careful, you might end up breaking your watch.  Don't say you weren't warned.  It's not my fault if your watch ends up in 1000 different pieces.

The first step is to find a nice flat piece of metal, this is placed against the back plate.  In my case I used a large washer with a small hole in it.  You'll then need to find a stiff piece of rubber that pushes up against the front of the watch.  I found what I think was a rubber screw on foot from something like an old piece of furniture.

This all gets placed in the vice.  Make sure it is centred in the jaws as the whole point of this is to exert a gradual uniform pressure on the backplate to clip it back into place.

Vice
Watch in Vice

The next step is the one that will make you sweat and is something I can't describe.  If you've used a vice a lot you'll get a feel for how much pressure it's exerting by the resistance offered when turning the handle.  You want to gradually turn the handle while observing the watch from the side.  The gap between the backplate and the front will slowly close and then all of a sudden it will snap back into place.

Vice
Watch Compression Stack

So yeah, it'll work, but it's high risk.  You're better off going to eBay and searching for a watch press.  They cost something like $16 Australian delivered from China for a cheap one.  It'd be handy to have a die to clamp connectors together too, you know like the old db9 ribbon cable ones.

Sorting Subjective Items With Software

$
0
0
Have you ever needed to sort a large number of items that don't have an easily defined order?  Maybe it's what TV to buy or where you're going for a holiday.  Some things only have a specific order to you. So ordering them with software isn't an easy option.  To simplify the process I wrote Sortamajig.  Watch it in action.


For a long time now I've know that the ballot paper for the 2016 Australian senate elections had a chance of being large, and because I'm a little pedantic/broken I like numbering all the boxes. The ballot paper for the Australian senate can get a little complicated.  You have the option of voting for at least 6 parties(sort of) above the line (which automatically selects the candidates under the line in order), or numbering at least 12 individual candidates under the line.  That might not seem hard, but in the 2016 election the ballot paper for Queensland will have about 40 columns and 122 candidates under the line.  This is where Sortamajig helps.

Ballot Paper
Australian Senate Ballot Paper

All I have to do is feed it a group of images and it will continue asking me to choose between two of them until they're sorted.  If I can't make a choice, there's a button to randomly make a choice for me.  If I make a mistake there are undo and redo buttons as well.  When the sort is complete, I click on generate output and an image grid and text file of the results is generated.
GUI
Sortamajig GUI

Now to test out the program I needed something I can sort that's subjective and easily comparable.  So I decided to go with Jelly Beans, particularly Jelly Belly brand.  I love them, and people's favourites vary just as much as their favourite politicians.
Jelly Beans
Test Jelly Beans - Barcode 07156798554
To generate some data I decided to do three trials on separate days and combine the data into a final result.  Some flavours can overpower the next flavour tasted, to prevent this the tasting order was randomised on each trial by shuffling a 50 numbered pieces of paper and placing them in the compartments on the box tray.  The jelly beans were tasted in this order.

Jelly Beans
Randomized Sampling Process
Below are the results of the three trials in image form.  The jelly beans are ordered from left to right and then top to bottom.  For instance, in the first image Strawberry Jam is first and Plum is second.
Jelly Beans
Trial 1
Jelly Beans
Trial 2
Jelly Beans
Trial 3
To combine the results I averaged the position of each flavour in the different trials and re-ranked them using the average.  The graph below shows the average position on the horizontal axis and the position and spread of the three trials on the vertical axis.

Graph
Aggregated Trial Results

An interesting thing I noticed when processing the results of the 3 trials is that I'm reasonably certain about the flavours I like the most and least.  In the middle of the rankings however, the positions of a particular flavour in each trial has a wider spread and is less certain.

The code is really rough and needs to be cleaned up.  If you have a look at the Github repo at some point in the future I may have improved it.
Get The Code!
Some of the groundwork for this tool can be found in these other posts.

Merge Sort... Sort Of 
Smart TkInter Image Manager for Labels
A Python Sorting Manager With a Human Comparison Operator
Visually Appealing Image Layout Algorithm

Now for the important part.  What were my results?

01.  Lemon Drop
02.  Pomegranate
03.  Tutti Fruitti
04.  Plum
05.  Orange
06.  Raspberry
07.  Lemon
08.  Lemon Lime
09.  Strawberry Jam
10.  Tangerine
11.  Bubble Gum
12.  Orange Sherbet
13.  Pink Grapefruit
14.  Red Apple
15.  Cotton Candy
16.  Green Apple
17.  Wild Blackberry
18.  Blueberry
19.  Grape
20.  Island Punch
21.  Crushed Pineapple
22.  Strawberry Cheesecake
23.  Pina Colada
24.  Strawberry Daiquiri
25.  Buttered Popcorn
26.  Berry Blue
27.  Margarita
28.  Cream Soda
29.  Peach
30.  Caramel Corn
31.  Very Cherry
32.  Cherry Cola
33.  Mango
34.  Kiwi
35.  Watermelon
36.  Toasted Marshmallow
37.  Coconut
38.  Chocolate Pudding
39.  Cantaloupe
40.  Caramel Apple
41.  Vanilla
42.  Juicy Pear
43.  Green Tea
44.  Top Banana
45.  Dark Chocolate
46.  Cafe Latte
47.  Liquorice
48.  Cappuccino
49.  Chili Mango
50.  Sizzling Cinnamon

Find & Copy Files While Adding The MD5 Hash To The Filename

$
0
0
Today I thought I'd show you a small script I'm using to decommission an old computer.  To make sure important files weren't deleted I wrote a BASH script that finds all files on a drive with a certain extension and copies them to an external drive.  This works well but sometimes two different files have the same name.  To make sure one doesn't overwrite the other, the file name is appended to its MD5 hash.  I know MD5 has security issues, but it's fine for this.

#!/bin/bash

find /mnt/sda3 -iname '*.pdf' -o -iname '*.svg'|while read line; do
    fname=$(basename "$line")
    md5=$(md5sum "$line" | awk '{print $1}')
    echo "'$line'"
    echo "'$md5'"
    cp -n "$line" /mnt/sdb1/"$md5""$fname"
done


The find command specifies the file types to look for, and where to look, in this case /mnt/sda3.  A while loop then processes each result by copying the file to an external drive (/mnt/sdb1) and changing it's name by adding the md5 hash to the front of it.  Copy is set to not overwrite any duplicate file names quietly. That's fine.  Two files with the same name and MD5 hash are exactly the same so you don't need both copies.

The script is written in BASH because I'm using a live version of Linux to recover the files on the computer.  It's an old Windows computer, but I'd rather do this with Puppy Linux than Vista.  Anyway, if you plan on using the script, do some small tests first.
Viewing all 99 articles
Browse latest View live